Getting Started with Google Analytics

Why use Google analytics?
Digital marketing is constantly evolving and is proved to be an unavoidable area if you wish to attract the audience to your website, build your brand and ensure a strong online presence. There are various techniques you could use to push your website to the fore, attract more audience and divert more traffic to your website. It includes various strategies like Search Engine Optimization (SEO), social media management, email marketing, promotions, pay per click (PPC) ads and many more. But how do you know if you are using the right strategies and in the right direction? How do you know your efforts are paying off? Yeah, you could probably tell it if you have an increase in the number of subscribers to your blog, or if there is an increase in the sale of your product, etc. But that need not be an accurate measurement for your SEO or digital marketing success. To know that, you need some information and statistics that could say how well your website is performing. This is where we need web analytics.
Web analytics is the process of measuring, gathering and reporting web data. This web data gives an idea about how the users on your website behave and how visible your site is. The web data could be the number of website visits, geographic location of visitors to the site, source of the traffic to your site, popular pages, and products in your site, how many times a page has been shared or the number of comments on each post, and much more. This data helps you optimize your website usage and traffic. It can also be used to gain insights for business and market research and improve the effectiveness of your website. Web analytics tools help track the web data, organize it, and present data of the site’s performance. That’s were Google analytics comes in.
Google Analytics is a web analytics tool from Google. It comes for free- anyone with a Google account can set up an Analytics account. There is a more advanced version of the tool- Google Analytics 360 which is a paid version. Small and medium sized businesses can depend on the free version and larger enterprises only might have to go for the paid version.
Google analytics essentially helps you get the most out of your analytics information and enable you to use it to optimize your website. Some of the features that Google analytics can give you are how long users stay on your page, their location, traffic flow to your website, information about referrers where visitors come from, etc. It can also give advanced information like visitor segmentation which enables you to know the number of new visitors that your SEO campaign brings to your website and website bounce rates which indicate the measure of users viewing only one page of your website before leaving the site. This kind of information helps website owners fine tune their website and manage content effectively based on customer response.
Ability to integrate with various tools like webmaster tool, AdWords, various survey and testing tools is another advantage of Google Analytics. It also provides mobile statistics, search statistics, social reporting and e-commerce reporting which can track sales activity, revenue and performance.
Setting Up Google Analytics Account
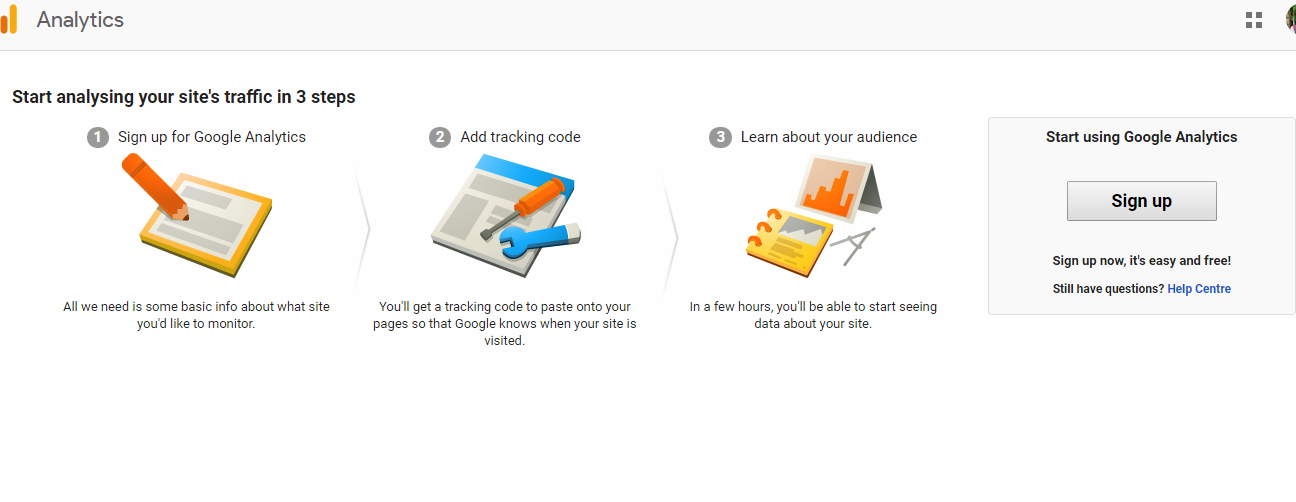
If you have a Google account, you can use it to Sign in to Analytics and you can start analyzing your website in few simple steps.
Step 1: Set up your Property
A property in Google analytics means your website or app. It is the collection point for all the data from your site or app.Once you sign in to analytics you will land on the page below where you need to give details of your account and property.
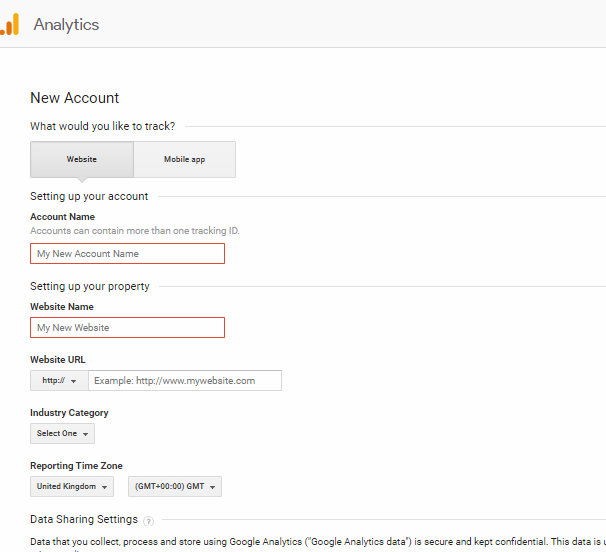
An account is the highest level in Google Analytics hierarchy. You can have up to 100 analytics accounts under one Google account and you can have up to 50 properties under one Google Analytics account. Say you have one business which has one or more websites and a personal blog you could have two accounts- one for personal blog and one for the business websites. On this page, you need to give details of your website (property) including the website name, URL, Industry category and reporting time zone you want to track.
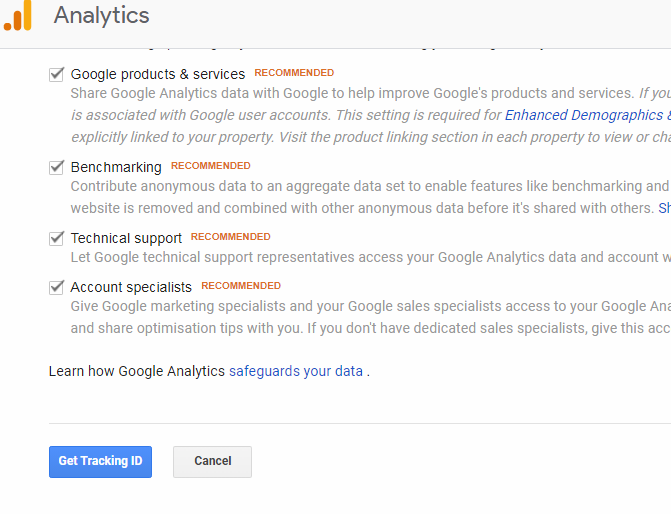
Beneath the set up, you also have the Data sharing settings, where you can configure where your Google Analytics data can be shared.
Once you enter the details, click the ‘Get Tracking ID’ button.
Step 2: Install Your tracking code
Once you click the Get Tracking ID button, you get a pop for Google analytics terms and condition.
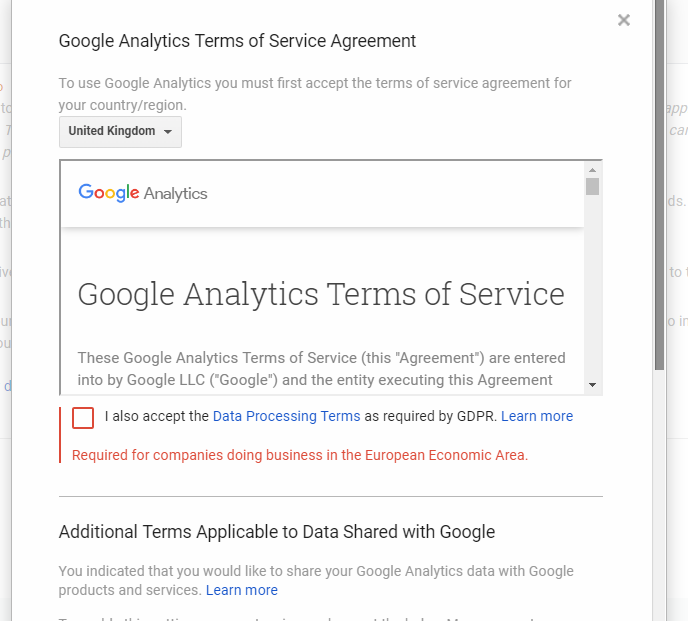
Upon agreeing to these terms and conditions you will get the tracking code for your website which has to pasted installed on your website pages.
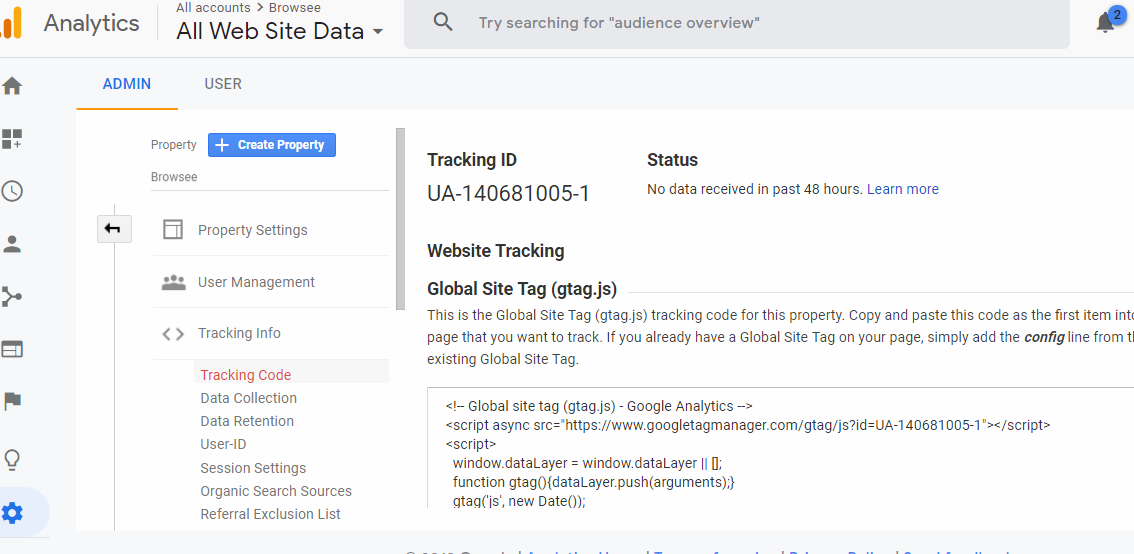
Once you install the tracking code you are all set to collect data. But you need to do some setting to collect the information you need. This can be done by setting up reporting views, Filters and Goals.
Step 3: Set up Views, Filters, and Goals in Google Analytics
Like I already mentioned before, Google analytics has a hierarchy in organizing your data where Account is the highest level. Under Account comes, the Property followed by View. These levels can be summarized as:
- Account - Contains data of all your websites.
- Property - Each website or mobile app you want to track is a property. A property essentially contains all data related to the corresponding website or app. Each property will have a unique tracking ID.
- View- A View is the level in analytics where you actually view your website data.
You can customize views by applying filters to show you the data you want to see. Google analytics will automatically create a view, by default named as ‘All Website Data’, when any new property is created. This is an unfiltered view. It is recommended that you always have this unfiltered original view for preventing any data loss. You can customize filters and set up multiple views for any property.
How to create a new View?
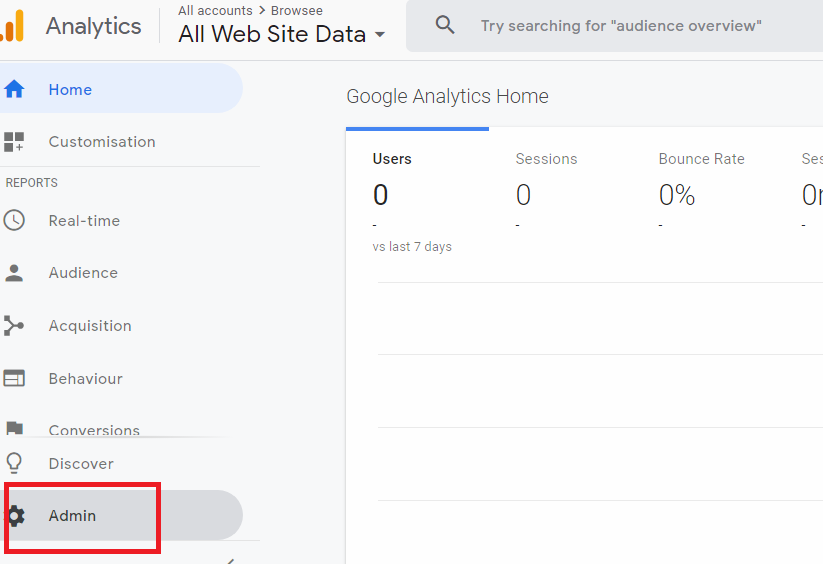
- Goto Admin Settings.
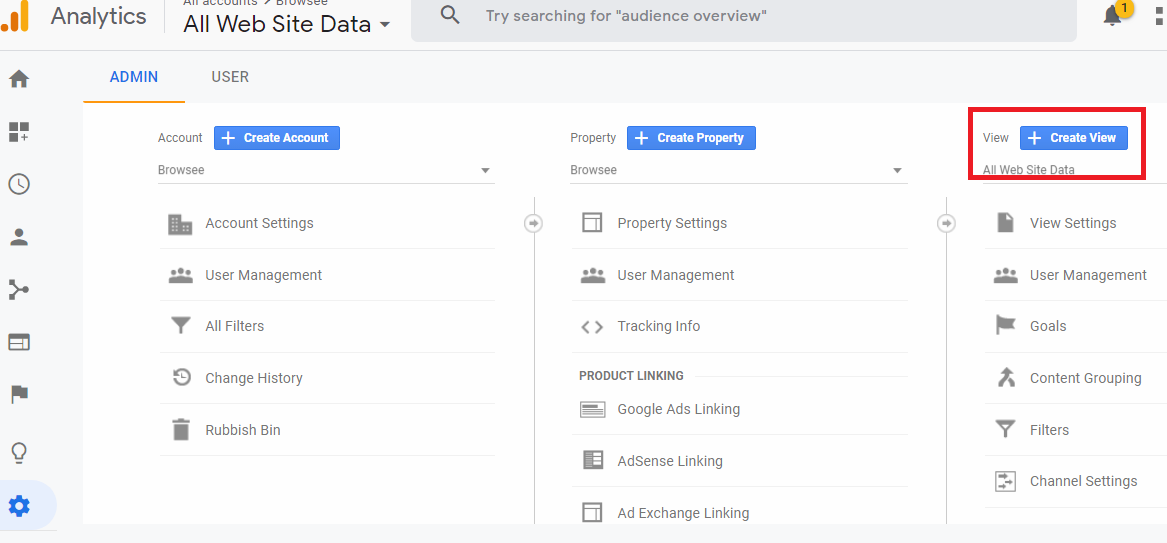
2. Click Create View.
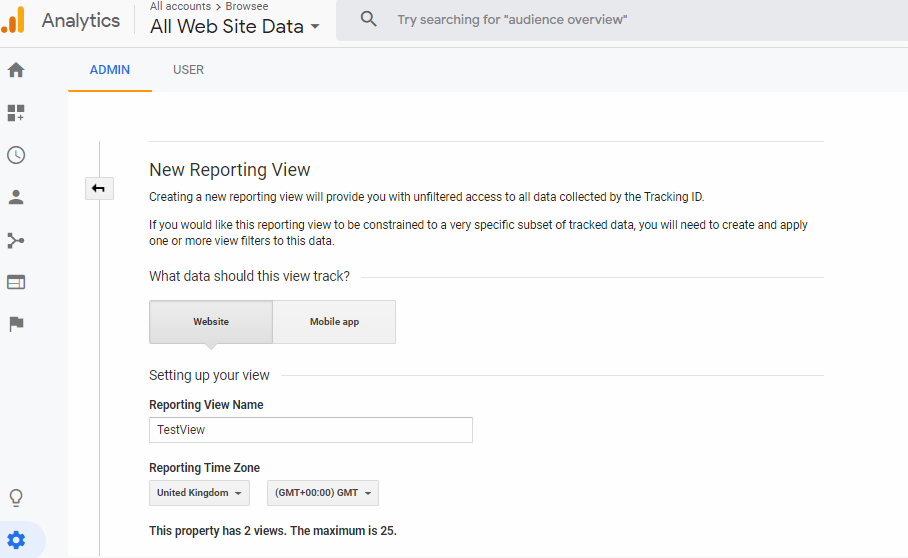
3. Select ‘Website/Mobile app’ based on what you want to track. Enter the Reporting View name and Reporting time Zone and create your new View.
You can create up to 25 View for one Property. Once you have created a View, you can go ahead with configuring View by setting up Filters, Goals, Segments, and much more.
Setting up Filters
You can set up filters at the Account level as well as View level. The filters created at account level can be applied to one or more views. If you want to create filters at View level that applies to that filter only, you can create filter at View level.
Now, what filters you need to set up? What are the filters you have in Google analytics?
Well, the most important filter that you need to set up before starting your data analysis is to exclude yourself and your employees from the data because if you are included in the data collected, it does not correspond to your user data. You can do this by excluding your IP addresses. Some other uses of filters are to report on activity in a specific directory or to track subdomains in separate views, say you want to track www.example.com as well as help.example.com and tools.example.com, you can create a separate view for each and use filters to identify specified directory. You can also set up location-based filters.
So that takes to our second question - “what type of filters you can set up?”. Well, the answer is ’ so many’. Google analytics offers some pre defined filters which you can use readily and you can also create Custom filters thus giving you endless filters.
The pre defined filters in Google Analytics are:
- ISP domain Filter: This filter can be used to exclude/include traffic from a specific ISP domain, such as a company network, say example.com.
- IP address Filter: This can be used to include/exclude clicks from specific IP address. You have options to include/exclude IP address range by using options- ‘that begins with’ or ‘that ends with’.
- Subdirectories filters: This can be used to exclude/include traffic to a particular subdirectory, such as /help.
- Hostname Filters: This can be used to include/exclude traffic to particular hostname, say support.example.com.
How to create a filter?
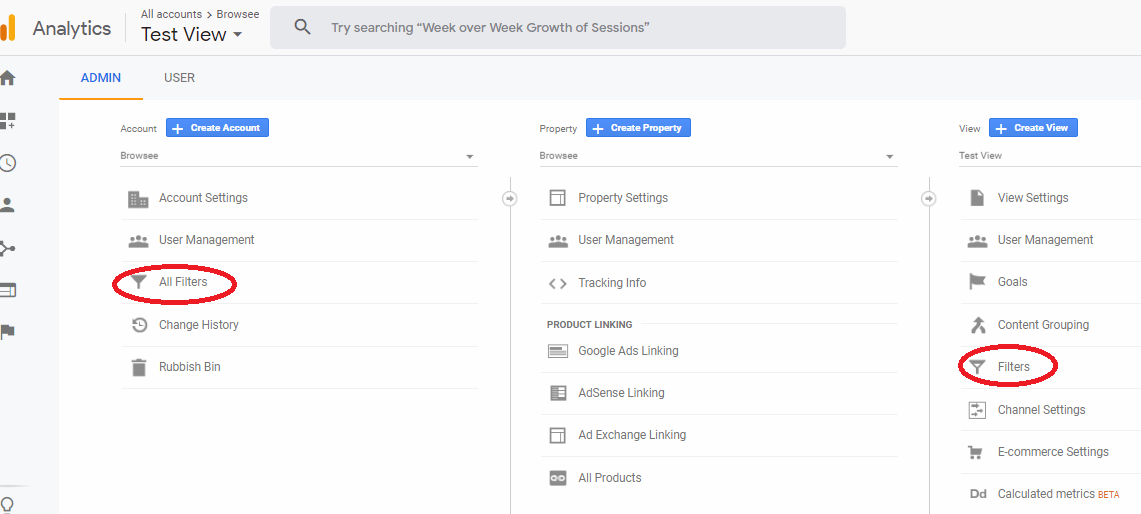
- Click Admin, and navigate to the account/View (based on at which level you want to create filter) in which you want to create the filter.
- In the ACCOUNT/VIEW column, click All Filters.
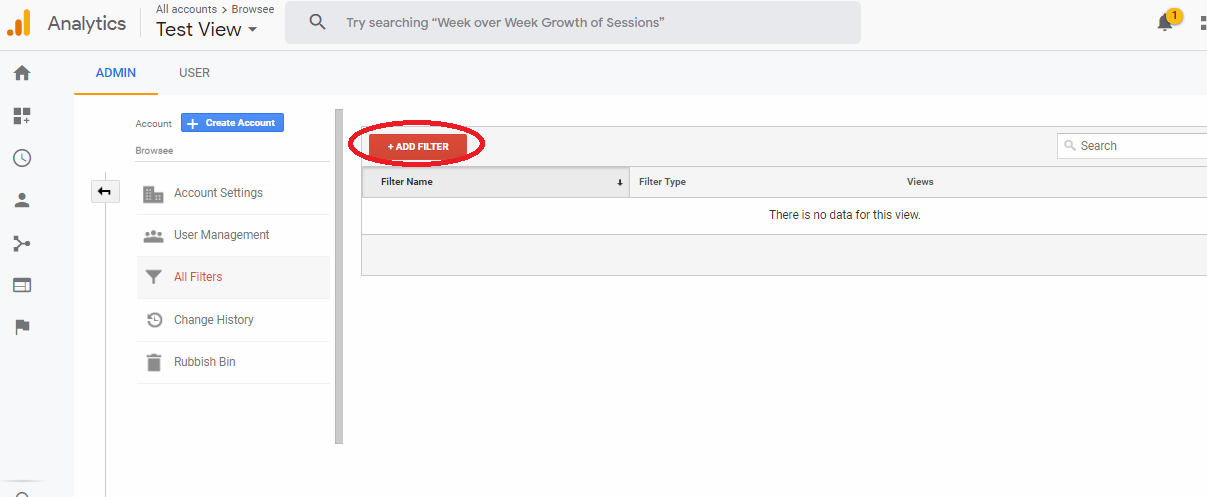
3. Click + Add Filter.
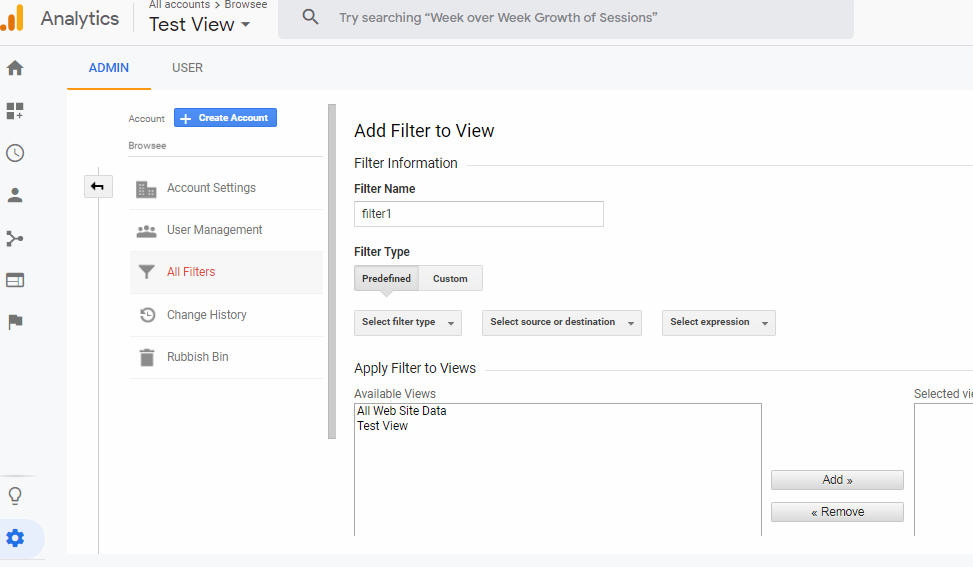
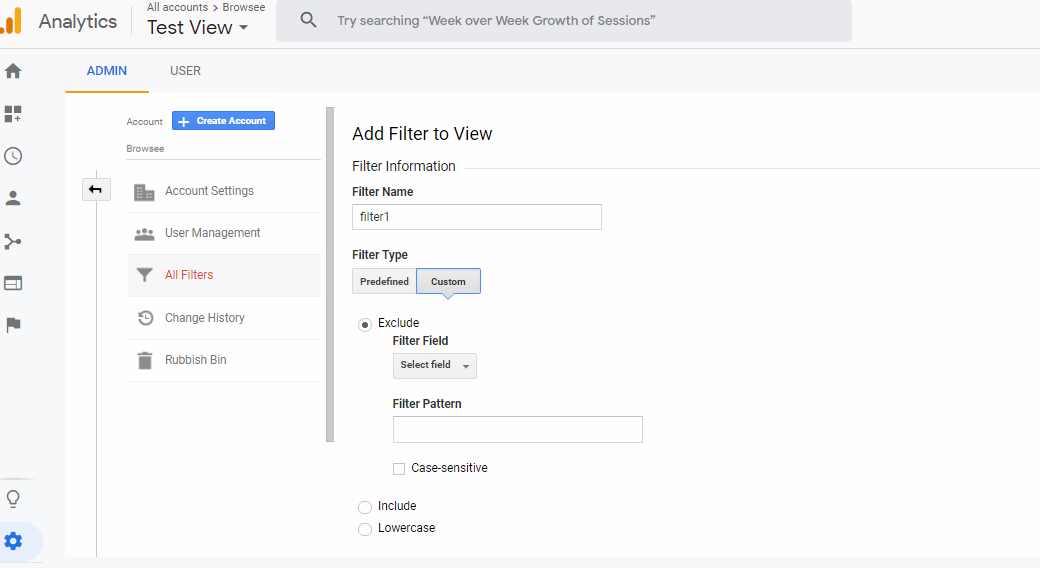
4. Enter a name for the filter.Select Predefined filter to select from the predefined filter types or select Custom filter to create a custom filter based on your need.
Setting up Goals in Google Analytics
Goals setting is another important set up you can do before you start collecting data. Goals can really help track and monitor your business objectives. A goal represents an activity ‘done’ or conversions which measures the success of your business. The goals may be submitting a lead generation contact form, a purchase made on your e-commerce site, or signing up for your SaaS and so on. Configuring proper goals allows google analytics to provide critical information like the number of conversions or conversion rates. This data is critical in evaluating the effectiveness of your website and marketing campaigns. You can have up to 20 goals under a reporting view.
There are 4 types of Goals in Google Analytics:
- Destination: The goal is set to check how many users land on a specific destination page, say a thank you page on making a purchase.
- Duration: This goal is set to check user sessions that last for a specific duration or longer- say you want to know how many users stay on your support site 10 minutes or longer.
- Pages/Screens per session: This goal is set to check for pages/screens in a session, say if you want t know how many users visited 5 pages or screens during their session.
- Event: This goal lets you measure the number of users who have performed any desired action defined as an event, say a Video Play, a Social recommendation or an ad click.
How to create a new Goal?
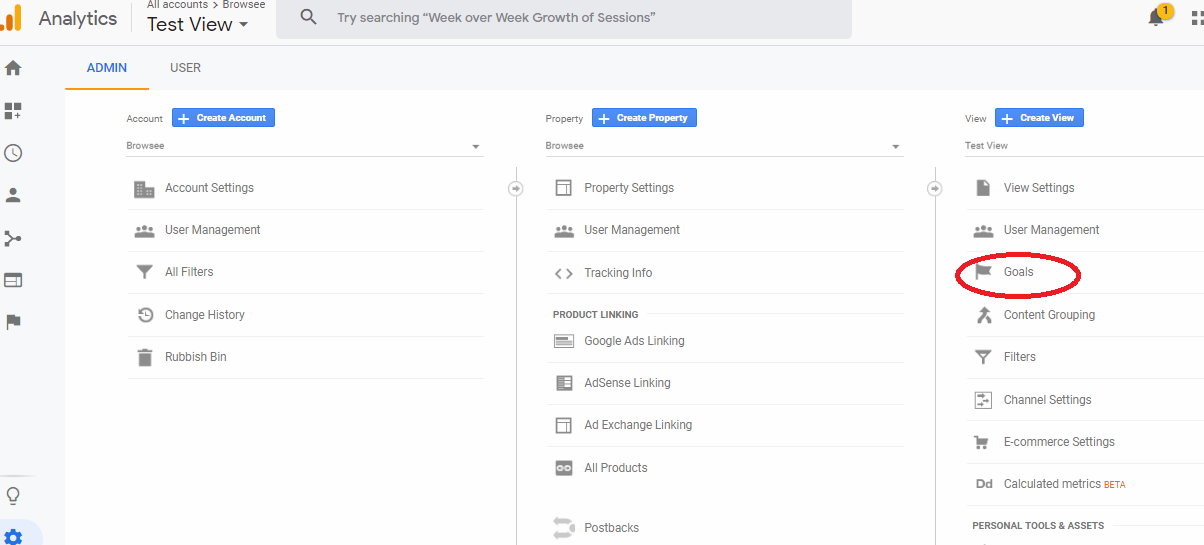
- Click Admin, and navigate to the desired view.In the VIEW column, click Goals.
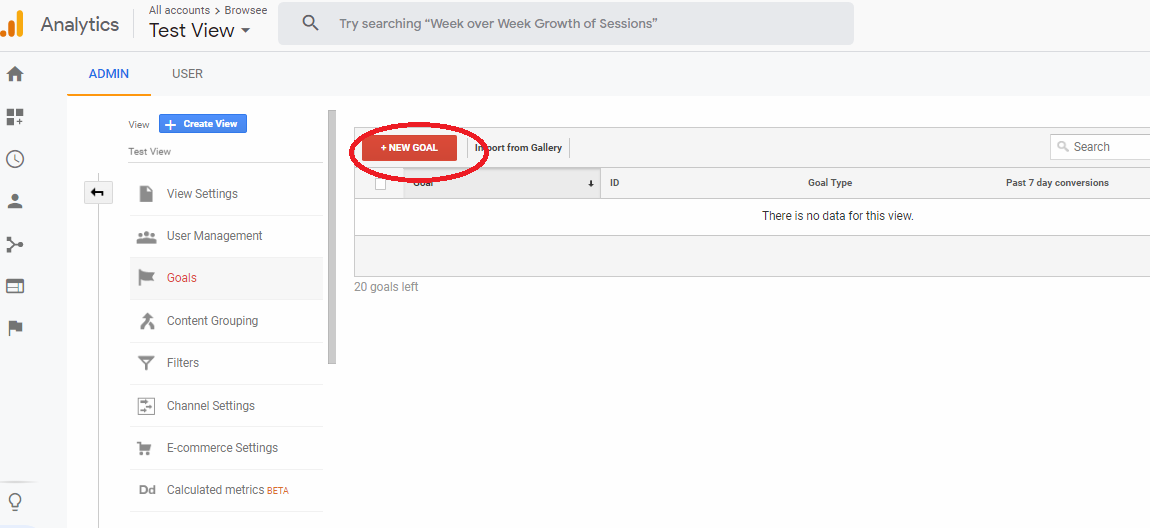
2. Click + NEW GOAL.
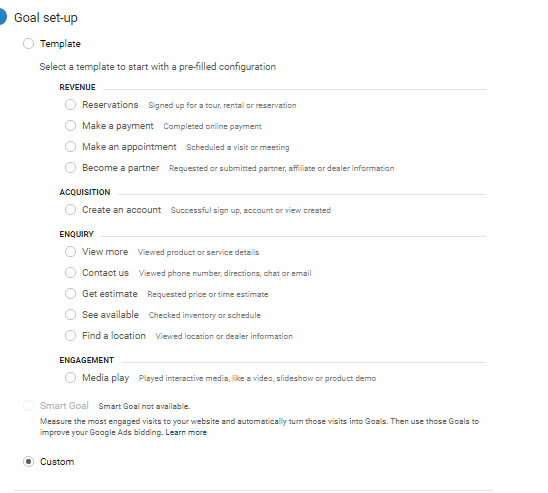
3. Then you land on the Goal set up page. You have 3 options for creating goals in Google Analytics- Selecting a template from the list (a list of goals that meet standard business objectives), Creating custom goals or creating smart goals.
Smart Goals use machine learning to examine dozens of signals about your website sessions to determine which of those are most likely to result in conversions. Each session is assigned a score, with the "best" sessions being translated into Smart Goals. Some examples of the signals included in the Smart Goals model are Session duration, Pages per session, Location, Device, and Browser. But there are some pre-requisites for you to have the option to create smart goals- first being you should have your analytics account linked to Google ads account and there are also some minimum requirements on the number of clicks from google ads account.
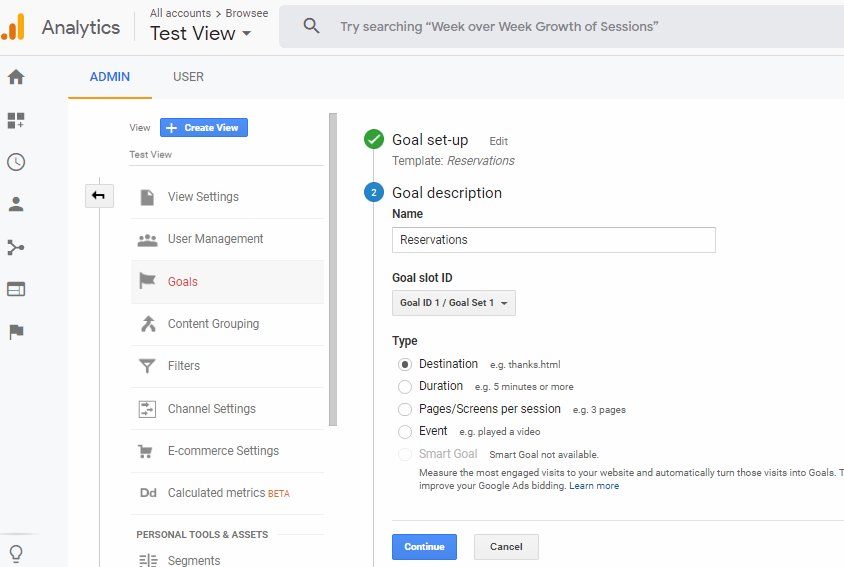
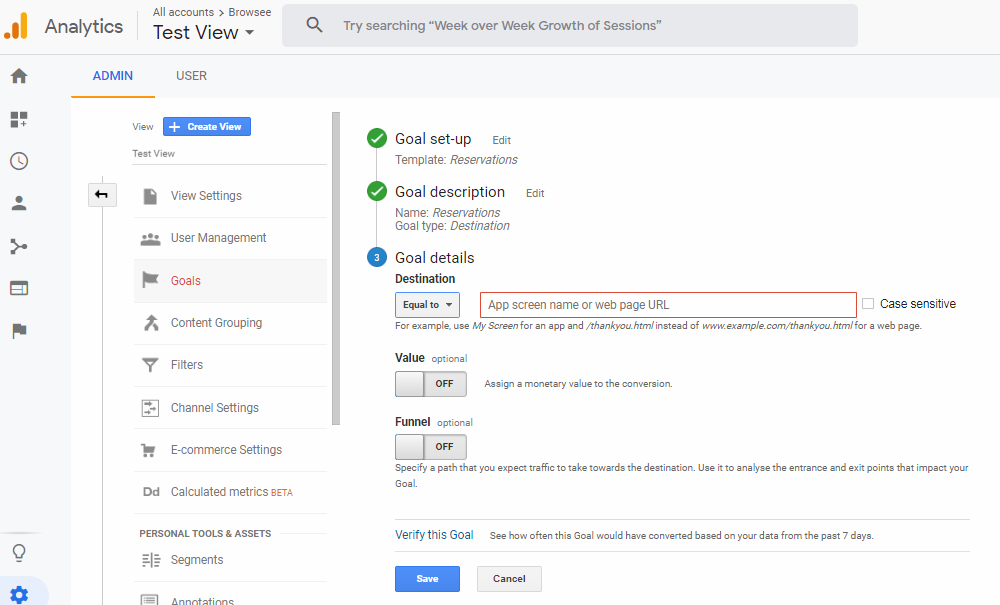
Select the option you want. Then you land on the Goal description page.
4. On the Goal description page, give the goal details like Goal name, type, etc and hit 'Continue'.
5. Now you land on the Goal details page, where you have to give more details of your goal like destination url if you are setting up a destination goal or duration if you are setting up Duration goal or so on based on the goal type you want to set up.
When you set up a goal, you have the option of assigning a monetary amount to the conversion. Each time the goal is completed by a user, this amount is recorded and then added together and seen in your reports as the Goal Value. This is an optional feature which enables you to convert the actions your users take to a monetary value.
Once you have entered all the details, click Save.
Yippee! That covers the basic settings to start tracking your website.
This blog is just an attempt to help anyone who is just getting started with Google analytics. These are just the basic steps you would have to follow to get started. There are numerous reports and tools like segmentation available in Google Analytics. Explaining or even just taking a look at all those is way beyond the scope of a single article. This is probably just good enough to get started. When you start using the tool, you surely will be able to explore and discover the tools that suit your needs. Happy Tracking!
How much is a great User Experience worth to you?
Browsee helps you understand your user's behaviour on your site. It's the next best thing to talking to them.

