Using Chart.js in React
React uses the JavaScript library Chart.js to produce charts and graphs. These charts and graphs can be displayed on websites. React Chart.js makes the advent of charts smooth for clients. We can create diverse charts, like bar graphs, line graphs, and pie charts. It is open-source and maintained by an active community.

Prerequisites
To understand the Chart.js React library, you will need to have a primary know-how of React. And React's documentation is a great place to start.
What is React Chart.js?
As front-end developers, we often want to add elements that would help customers visualize the data. Data visualization is a crucial detail of any internet site that can help customers in visualizing the data and comprehending them without problem. With the usage of React Chart.js, it's far more feasible to use charts.

React Chart.js is a JavaScript library for creating React charts and graphs. These graphs and charts can be used to display data on websites. React Chart.js makes the creation of charts easy for users. It is also suitable for big datasets. Also, the rendering of the chart elements is performed on an HTML5 canvas. The following charts may be made using the Chart.js library:
- Bar graphs
- Line graphs
- Pie charts
Installing Chart.js
Get started by creating a React app for your machine, or open your browser and visit react.new. The setup of a React project in a new CodeSandbox environment will be displayed. Next, install Chart.js
npm install --save react-Chart.js-2 chart.js
Creating charts: bar, line, and pie charts
Let’s have a look at some examples of charts.
We will create specific React components for charts only for the simplicity of this tutorial.
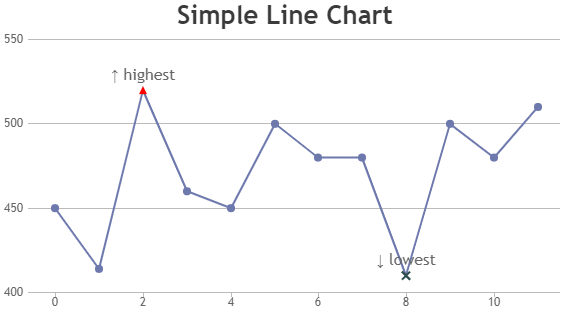
Line chart
Create new folder components, Inside, create a brand new record, LineChart.js, and upload the following code to it:
We begin by importing charts and lines from Chart.js and react-Chart.js-2, respectively.
All charts require labels to name each bar on the graph, and they use data as props to show information on the graph. The records prop has datasets that hold the property of the chart along with the height, width, and color of the graphs. We can edit datasets to alter the graphs' border and background colors, among many other attributes.
// ./components/LineChart.js
import React from "react";
import Chart from "chart.js/auto";
import { Line } from "react-Chart.js-2";
const labels = ["January", "February", "March", "April", "May", "June"];
const data = {
labels: labels,
datasets: [
{
label: "My First dataset",
backgroundColor: "rgb(255, 99, 132)",
borderColor: "rgb(255, 99, 132)",
data: [0, 10, 5, 2, 20, 30, 45],
},
],
};
const LineChart = () => {
return (
<div>
<Line data={data} />
</div>
);
};
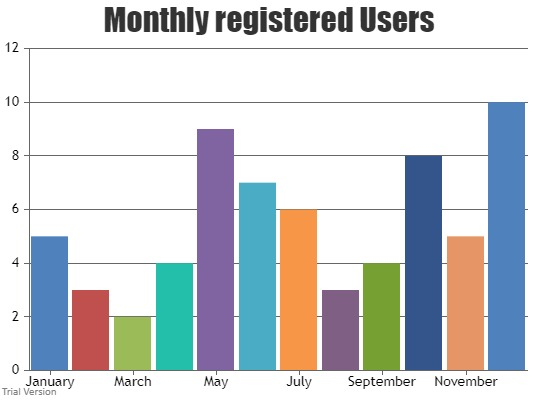
export default LineChart;Bar Chart
// ./components/BarChart.js
import React from "react";
import Chart from "chart.js/auto";
import { Bar } from "react-Chart.js-2";
const BarChart = () => {
const labels = ["January", "February", "March", "April", "May", "June"];
const data = {
labels: labels,
datasets: [
{
label: "My First dataset",
backgroundColor: "rgb(255, 99, 132)",
borderColor: "rgb(255, 99, 132)",
data: [0, 10, 5, 2, 20, 30, 45],
},
],
};
return (
<div>
<Bar data={data} />
</div>
);
};
export default BarChart;
Similarly, the syntax for all types of charts is the same. Labels and datasets are required for every graph in order to display information on the chart.
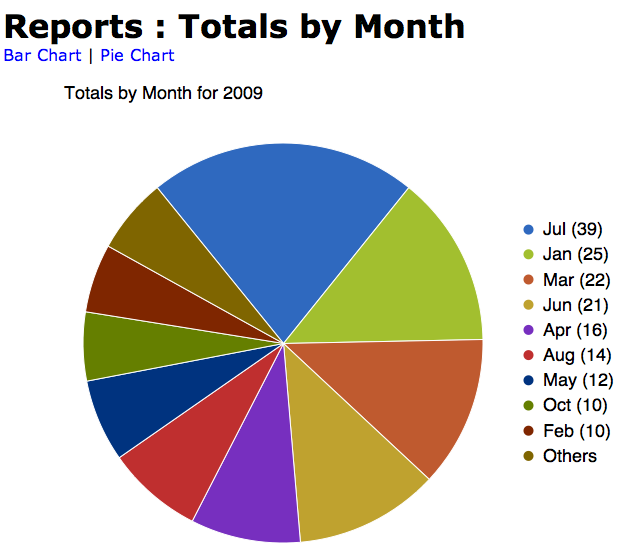
Pie Chart
// ./components/PieChart.js
import React from "react";
import Chart from "chart.js/auto";
import { Pie } from "react-Chart.js-2";
const labels = ["January", "February", "March", "April", "May", "June"];
const data = {
labels: labels,
datasets: [
  {
  label: "My First dataset",
  backgroundColor: "rgb(255, 99, 132)",
  borderColor: "rgb(0,0,255)",
  data: [0, 10, 5, 2, 20, 30, 45],
  },
 ],
};
const PieChart = () => {
return (
  <div>
    <Pie data={data} />
   </div>
  );
};
export default PieChart;
Now, there’s just one thing left: we need to import all these components into the App.js file. Import every element from the App.js file.
// App.js
import BarChart from "./components/BarChart";
import LineChart from "./components/LineChart";
import PieChart from "./components/PieChart";
function App() {
return (
<div>
<LineChart />
<BarChart />
<PieChart />
</div>
);
}
export default App;
After running your React app, you can see charts being displayed.
How to add data to charts
Now, let’s pass some data into these charts. Let’s upload static data of ‘The Most Popular Programming Languages’ to examine in 2022. We will add these data to a Pie chart.
Add this code to the PieChart.js file:
import { Pie } from "react-Chart.js-2";
import Chart from "chart.js/auto";
export default function PieChart() {
const data = {
labels: ["Go", "Python", "Kotlin", "JavaScript", "R", "Swift"],
datasets: [
{
label: "# of Votes",
data: [35, 25, 22, 20, 18, 15],
backgroundColor: [
"#007D9C",
"#244D70",
"#D123B3",
"#F7E018",
"#fff",
"#FE452A",
],
borderColor: [
"rgba(255,99,132,1)",
"rgba(54, 162, 235, 1)",
"rgba(255, 206, 86, 1)",
"rgba(75, 192, 192, 1)",
"rgba(153, 102, 255, 1)",
"rgba(255, 159, 64, 1)",
],
borderWidth: 1,
},
],
};
return (
<div style={{ width: 650, textAlign: "center" }}>
<h1 style={{ fontFamily: "monospace" }}>
The Most Popular Programming languages to learn in 2022
</h1>
<Pie data={data} width={50} height={50} />
</div>
);
}
Save the document and move it to your browser, and you can see how simple it has become to show some data on charts.
How to add dynamic data to charts
Now that we have discovered a way to show static data on charts, We will discover ways to add some real-time data to charts. We will pull a few data from the COVID-19-API and display that data on a line chart.
Let us get some data from the Covid-19 API, starting with installing Axios.
npm install axios
With that completed, create a brand new report, Data.js, in the components folder. We will be fetching all of the data in that record. Open the Data.js file and insert the following code:
import axios from "axios";
const url = "https://covid19.mathdro.id/api";
export const fetchData = async (country) => {
let changeableUrl = url;
if (country) {
changeableUrl = `${url}/countries/${country}`;
}
try {
const {
data: { confirmed, recovered, deaths, lastUpdate },
} = await axios.get(changeableUrl);
const modifiedData = { confirmed, recovered, deaths, lastUpdate };
return modifiedData;
} catch (err) {
console.log(err);
}
};
export const fetchDailyData = async () => {
try {
const { data } = await axios.get(`${url}/daily`);
const modifiedData = data.map((dailyData) => ({
confirmed: dailyData.confirmed.total,
deaths: dailyData.deaths.total,
date: dailyData.reportDate,
}));
return modifiedData;
} catch (err) {
console.log(err);
}
};
From this API, "https://covid19.mathdro.id/api," we have just retrieved the data. Unfortunately, they have stopped maintaining this API, but it is still useful for this tutorial. Now we need to show this data, so open your LineChart.js report and add the following code:
import React, { useEffect, useState } from "react";
import { fetchDailyData } from "./Data";
import Chart from "chart.js/auto";
import { Line } from "react-Chart.js-2";
const LineChart = () => {
const [dailyData, setDailyData] = useState([]);
const fetchApi = async () => {
const dailyData = await fetchDailyData();
setDailyData(dailyData);
};
useEffect(() => {
fetchApi();
}, []);
const lineChart = dailyData[0] ? (
<Line
data={{
labels: dailyData.map(({ date }) =>
new Date(date).toLocaleDateString()
),
datasets: [
{
data: dailyData.map((data) => data.confirmed),
label: "Infected",
borderColor: "rgb(0, 217, 255)",
fill: true,
},
{
data: dailyData.map((data) => data.deaths),
label: "Deaths",
borderColor: "red",
backgroundColor: "rgb(255, 0, 0)",
fill: true,
},
],
}}
/>
) : null;
return (
<>
<div>{lineChart}</div>
</>
);
};
export default LineChart;
We have created a new useState hook with variable dailyData to keep all of the information we fetched earlier in Data.js document, and then we've got a fetchApi feature that updates the value of dailyData. Next, we updated our datasets with the COVID-19 data. Then you’ll see the dynamic data displayed on your chart.
Advantages of React Chart.js
- Chart.js uses the Canvas element, which results in better overall performance compared to SVG.
- It is better to use Chart.js to render huge amounts of data, as it has a higher performance.
- It is straightforward to download the chart as an image when React chart.js is used.
- Less effort is required to create charts.
Disadvantages of React Chart.js
- There are fewer customization options.
- It only pertained to standard charts. If more varieties of charts are required, D3.js is a better choice.
- As the charts are totally canvas-based, they're non-interactive. It cannot be changed.
Conclusion
Chart.js is a JavaScript library that is used in React to create charts and graphs. These charts and graphs may be used on websites. It is desirable for large datasets. Also, the rendering of the chart factors is carried out on an HTML5 canvas. We can create numerous charts, like bar graphs, line graphs, and pie charts. Libraries like chart.js and react-Chart.js-2 are important to be hooked up on our device. Chart.js uses the Canvas element, which results in better overall performance in comparison to SVG. If you are a front-end developer, Chart.js is a good tool for you to create charts on your website.
How much is a great User Experience worth to you?
Browsee helps you understand your user's behaviour on your site. It's the next best thing to talking to them.

