Top 10 Analytics Tools For Product Managers
In today’s data-driven world, it is no secret that analytics is a crucial part of product management for one significant purpose; product improvement. Without analytics, product development will be just like a series of shots in the dark without any clue on how your product actually performs or how well it actually meets user needs and their expectations. The right data and product insights from analytics tools allow you to make informed decisions about upgrading product functionalities or adding capabilities to your product.
Simply put, product analytics can reveal the cold, hard truth about how well your product functionalities work and how the users really use them so that you can get a clear picture of your product results and use the information to optimize your product and build the best. The best product management analytics tools can give you a wealth of information and insights that can impact your goals.
In this blog, we discuss the top analytics tools for product managers that can give a multitude of insights to help drive your product management efficiently. The best analytics tools for your product team are the ones that your team can grow into. Here are a few factors to consider when you are looking for analytics platforms for your team.
- Depth of tracking: Can the platform track the right events and channels for your product?
- Integration: Can the platform integrate well with other tools or software that you use and has flexible APIs?
- Ease of implementation and use: What expertise is required to implement and use the platform?
- Support from vendor: Does the vendor provide enough support services?
That being said, let’s now take a look at the top analytics tools used by product managers.
1.Google Analytics
Google Analytics, the web analytics platform from Google, probably is the most widely used web analytics tool today. The best thing is it is available to everyone free of cost. It does have premium versions of Google Analytics 360 with more features. But the basic version is good enough for most of the businesses and gives a lot of insights to users. The team at Google is working on improving the features every day. But the use of Google analytics requires some technical knowledge compared to many other tools in the market. But if used right, it can beat most of the analytics tools out there in the market and can give almost every insight that you are looking for. Just that it may require you to do some additional steps and set up some configurations.
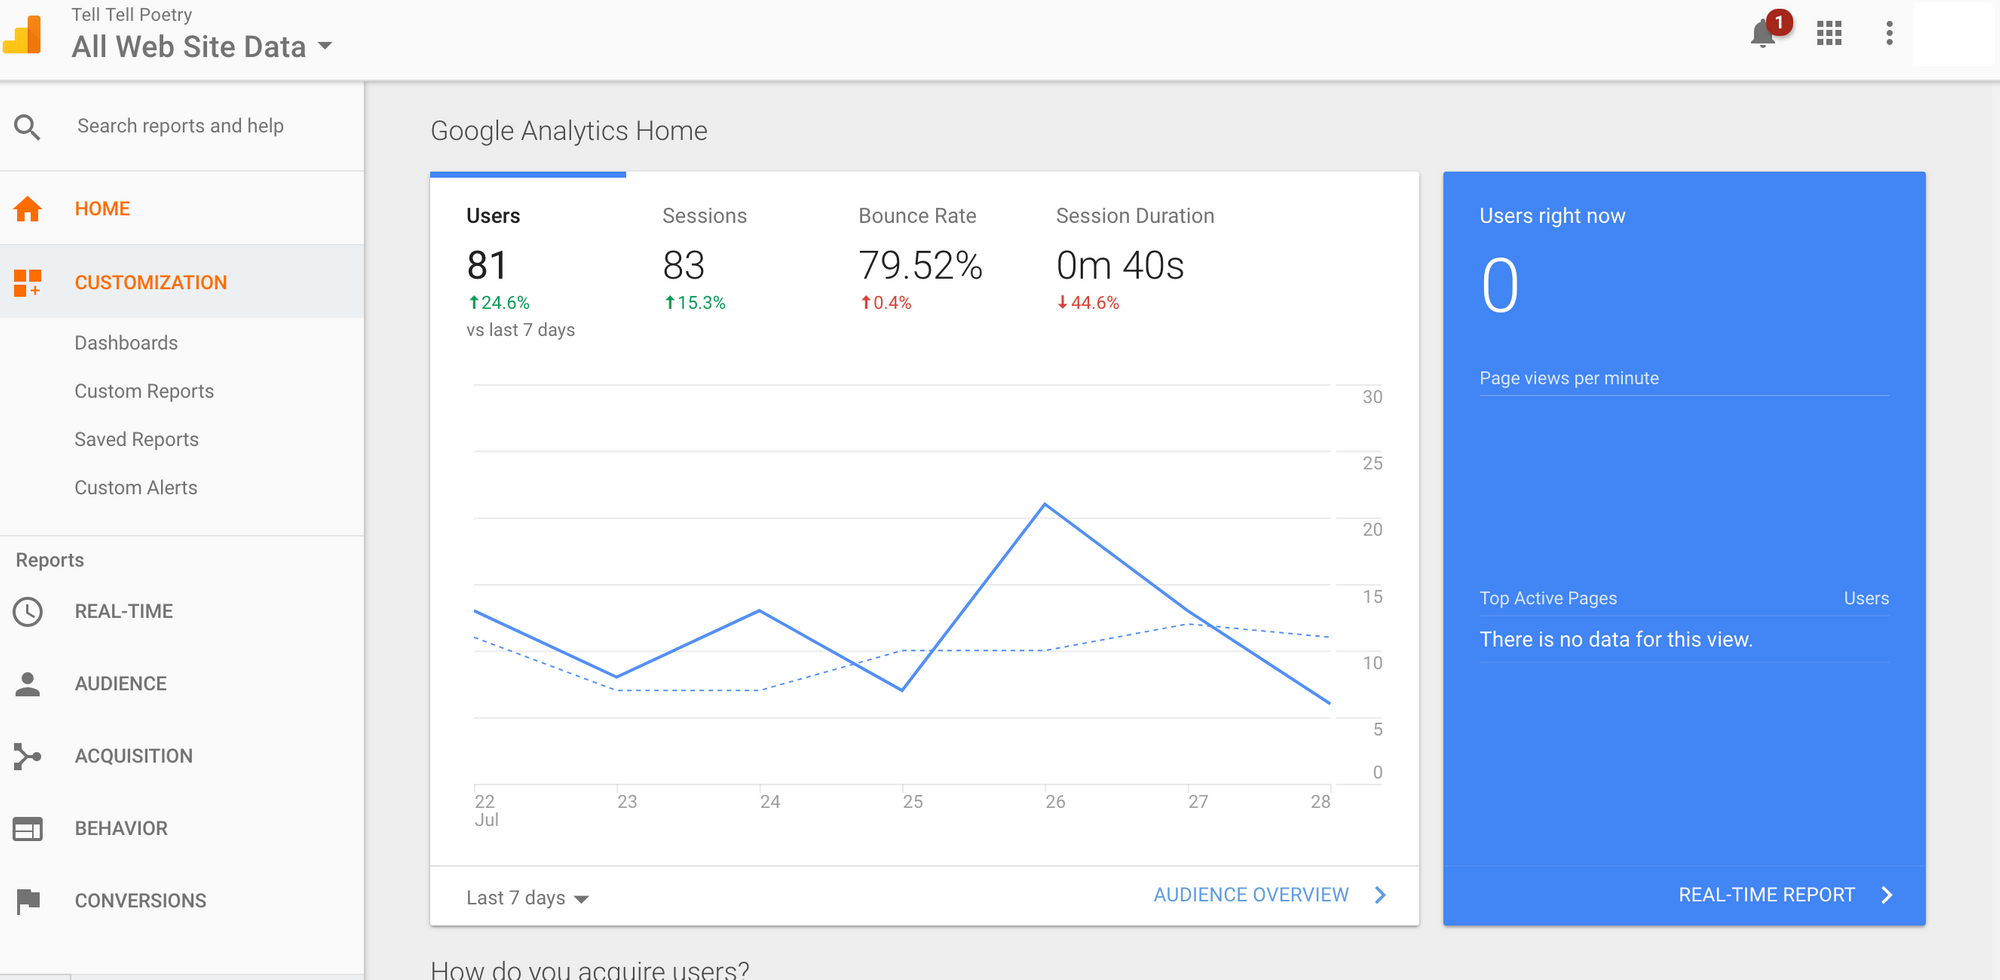
The new Google Analytics platform has the best features of its analytics program and have made it even easier to use with its latest organization and visualization features. Here are some of the insights that you could get from Google analytics:
- Basic performance Insights like the number of users over a period of time, which days you had the most number of users, etc.
- From which channel you get your users - organic, social media, referral, or other paid campaigns.
- Understand trends like bounce rate over a period of time, daily session trends, the growth rate of users, etc.
- Top-performing landing pages and content.
- User behavior insights like which browser or device most of the users use, what are the top event actions performed by users, session duration of new users or returning users, etc.
- Geographic insights like what countries od users come from or how many users from any specific region, what language they use, etc.
Pricing: Free
2. Optimizely
Optimizely is a very popular experimentation platform that can be used by product and marketing teams to deliver high-quality products with better user experiences with data-driven confidence in the results rather than going by intuitions. The platform can be used for testing websites, backend code, mobile and conversational apps.
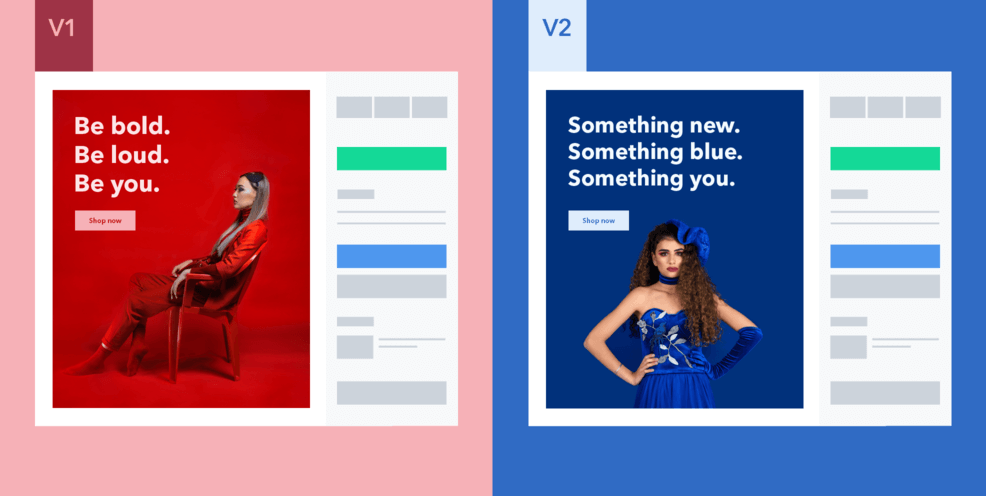
The platform allows you to run experiments across your website/landing pages or apps to uncover customer insights that can be used to optimize the landing page/app. You can deliver experiment variations to visitors by ad campaigns, geography, cookies, etc and discover what is resonating with your audience.
At the end of experimentation, you may get winning variations, losing variations or inconclusive variations. You can take live your winning variation if you happen to get a single winner and if there is no clear winner, iterate with new ideas or by combining ideas from various versions until you get a winner.
Optimizely can help you track user behavior by tracking various metrics like:
- Bounce rate or exit rate metric.
- Track visitor actions like clicks, page views, form submissions, purchases, etc.
You can really dig into the data to investigate the results of the experiment to look for more valuable insights from results like:
- Identify what went wrong in losing and inconclusive variations or what users expect and how you can provide it.
- Identify why the winning version really won and what changes of it from other variations generated the result.
Optimizely thus allows product managers to create great products by rolling out new features by testing small changes and functionalities on a small percentage of users and only apply the changes that work.
Pricing: No free plan, Starts at $50000.00 per year
3. MixPanel
MixPanel is a platform that allows product managers and teams to analyze user behavior across their products, websites, and apps. This analytics tool can also take your user analytics a step further with data models that identify behavioral correlations and alert you when any important metrics change and allows you to uncover why your users behave the way they do, using its data science models.
Mixpanel also allows you to run targeted campaign experiments using multiple versions of web pages or email, SMS and in-app messages to see what works. It allows you to collect accurate customer data, identify trends, understand the why and take action based on data-driven insights. With the out of the box reports from Mixpanel product or marketing teams can go deep in analyzing user behavior and use the data to build better campaigns or products.
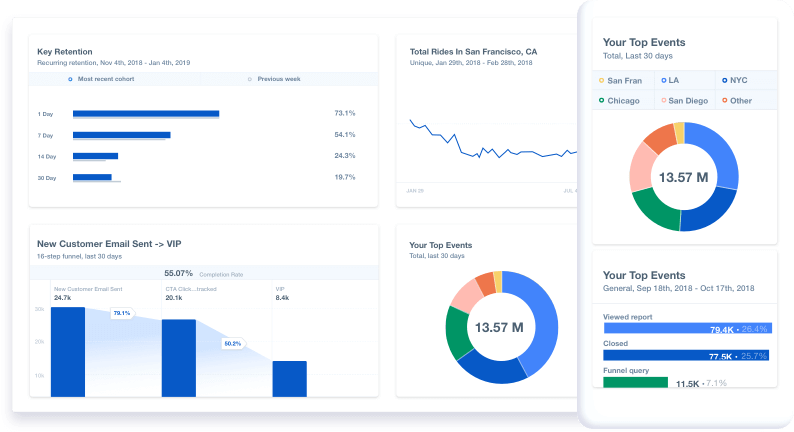
Here are some of the user behavior insights you can get from Mixpanel:
- Segment and visualize data for various segments you would like to know about like by country, by date, by device, etc.
- Learn about your users- who they are or where they are from.
- Visualize how users explore your product or website, which path they take to accomplish goals, and so on.
- Compare how different groups of users behave.
Pricing: Starter pack free and Premium plans start from $89/month
4. Geckoboard
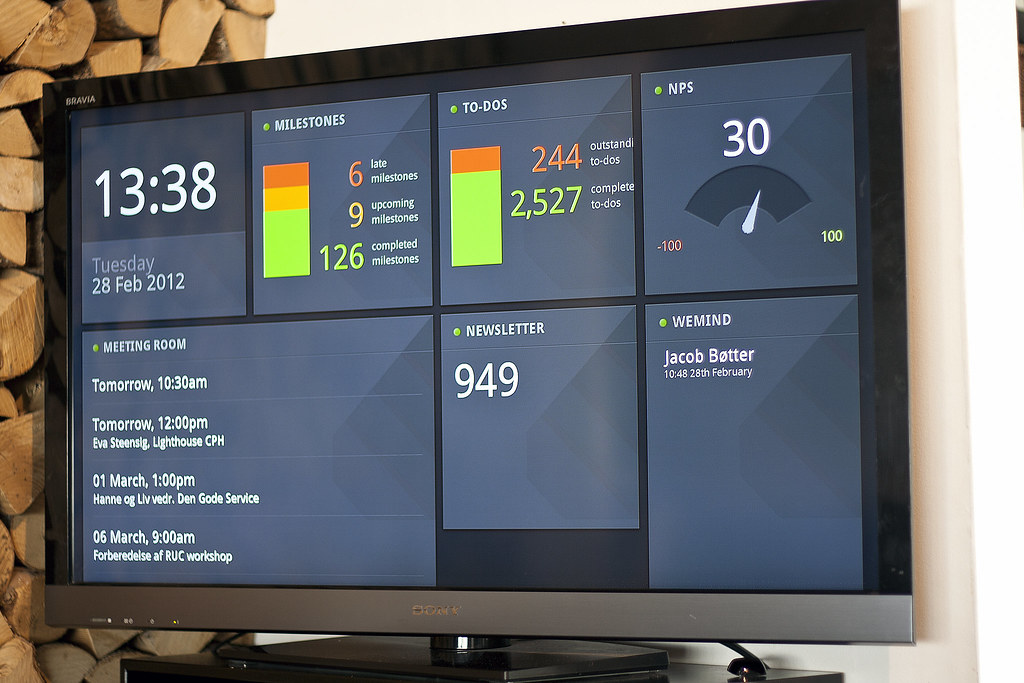
It is a live TV dashboard software that displays your key metrics to everyone so that they can instantly see how the organization is doing. It allows you to get data from all your tools and systems without any coding. You can then filter the data to show what exactly you want to show and choose from beautiful visualizations in its easy to use interface and share your metrics on a TV in no time.
You can collect data from various data sources including analytics tools you use, your customer support tools, social media, your marketing tools, etc and build dashboards in Geckoboard to project your metrics to your team so that hay can get a clear picture of performance and prioritize their actions to growth. For example, you can create a dashboard for your product activity or product KPIs or a dashboard for tracking real-time customer support by taking data from your corresponding data sources. Some of the metrics you can track in the dashboards are:
- The number of downloads of the product.
- The number of active referees.
- Product popularity
- Bugs created vs solved
- Number of clicks on a new feature
- Customer satisfaction
These are just a few things. You can really include any data from your systems to the dashboard.
Pricing: Starts at $31/month
5. Crazy Egg
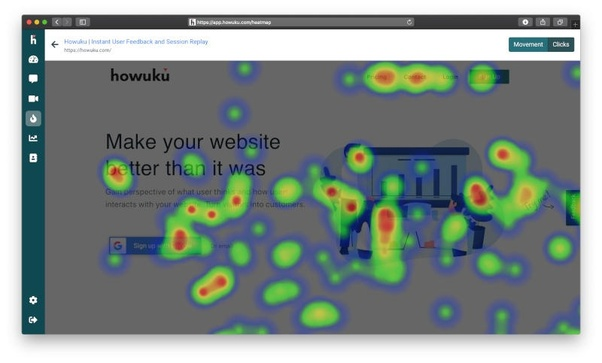
Crazy Egg is a website optimization tool to monitor your website user experience. It gives users heatmaps, scroll maps and click reports which allow you to see how visitors interact on your website. It can also be used for session recording to understand general patterns of how people browse your site or identify where people drop off during a session.
Crazy egg also offers A/B testing tools allowing you to test different variants and as soon as the tool detects a winning variant, it automatically sends more traffic to the variant so that you can optimize your conversions.
The insights from the heatmaps, session recording, and A/B testing can be combined to make significant UX improvements to optimize conversions. With the crazy egg tools you can:
- See in real-time how users are interacting with your products using session recordings.
- Drill down to how your landing page elements like CTAs or any particular areas using heat maps.
- Track what is going on behind pop up forms or your login screens.
Pricing: Starts at $24/month
6. Cyfe
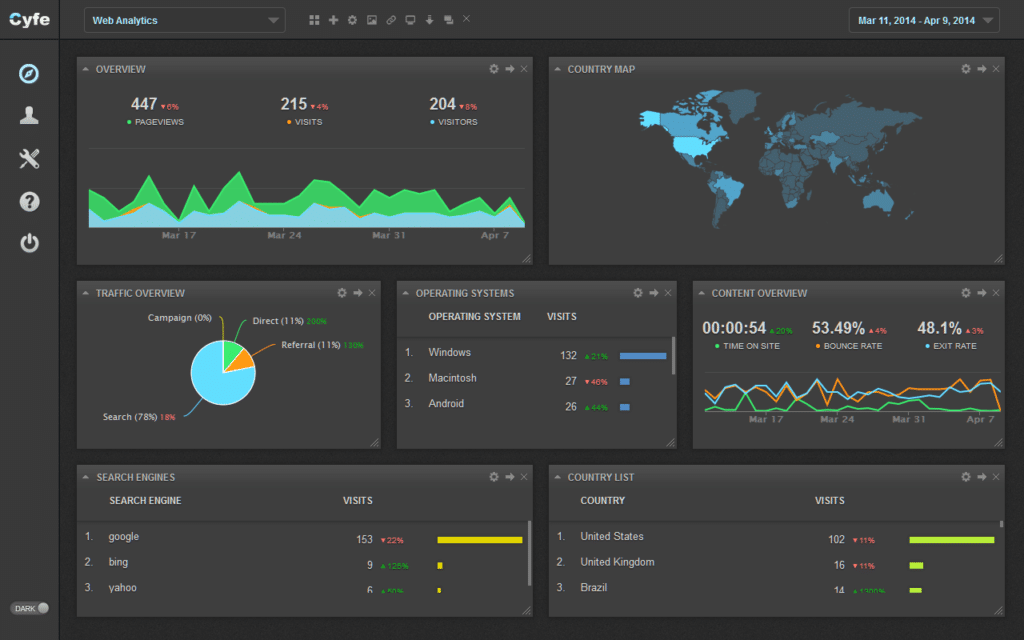
Cyfe is an all-in-one dashboard application that enables users to monitor a variety of channels including web analytics, social media, marketing, sales, support, etc. It can collect data from a variety of platforms including Salesforce, Google AdWords, Google AdSense, Bing Ads, Campaign Monitor, Mixpanel and more.
Cyfe’s key features include pre-built widgets, Push APIs, real-time reports, data exports, TV mode, and intuitive reports and dashboards. You can create custom dashboards from the various data sources and share them with stakeholders like management, clients or any other users via public URLs, scheduled reports or Cyfe accounts.
Thus, Cyfe simply makes it quick & easy to automate your reporting and provide precise measurement on all KPIs- be it customer acquisition, return on investment, cash flow, social traction, advertising performance, sales pipelines pr progress of your goals.
You can literally track anything for your product or app- number of sign-ups, app downloads, subscriptions, and much more. It can help you monitor in real-time how your organization is growing by using the dashboards.
Pricing: Basic plan-Free and paid plans start at $29/month
7. Kissmetrics
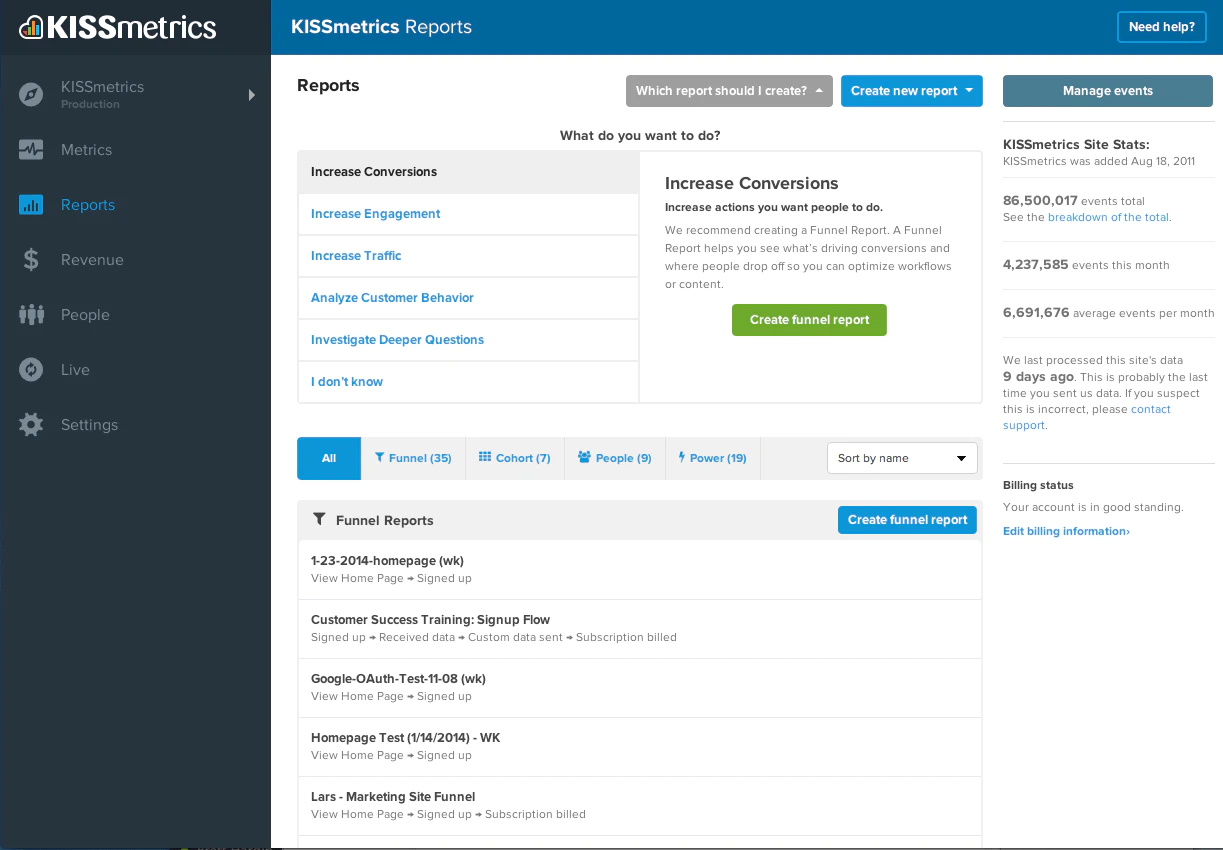
Kissmetrics is a user-based analytics platform that enables users to analyze users’ interaction with a website. It can provide valuables insights to product and marketing teams on how the product or campaigns work, helping them to make better decisions and better understand their users. It has all tools you need to analyze user behavior like metrics dashboard, Funnels, Customer Journey Reporting, Cohorts, Behavior and Trigger-based notifications and much more.
Here are a few insights that Kissmetrics can give you:
- Which marketing campaigns are bringing the most traffic to your website?
- How are your landing pages performing?
- Which search-terms drive more traffic to your website?
- How far users are going through your installation or upgrade process?
- Where do users get hung up?
- How are people reacting to your new features?
Pricing: Starts at $200/month
8. GoodData
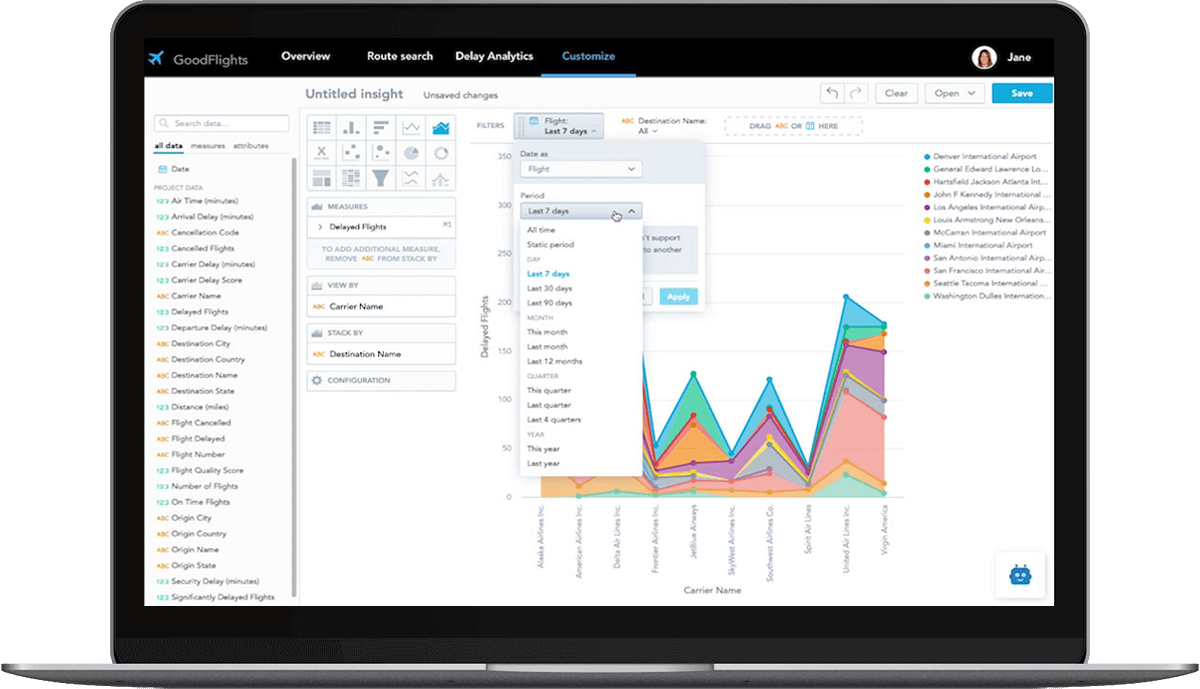
Good Data is a powerful analytics platform with embedded BI providing fast and reliable analytics with pretty visualizations that is easy to use. It has intuitive dashboards and easy-to-use drag-and-drop self-service analytics designed to give valuable insights to businesses. Some of the notable features for the platform are:
- Contextual data models and powerful, easy-to-use MAQL language
- Out-of-the-box and custom predictive or prescriptive machine learning algorithms.
- Easy out-of-the-box integration with existing cloud or on-premise data warehouses.
- Huge analytics capacity, from tens to 50k+ tenants with TBs of data.
- You can use your tools for data preparation including SQL, Python, R, Scala, Docker, machine learning scripts and front-end integrations JavaScript, React, Angular.
- Tools to track usage, adoption, data distribution, and real-time events.
Pricing: Basic plan- Free, Paid plan starts at $20/month
9. Zoho Analytics
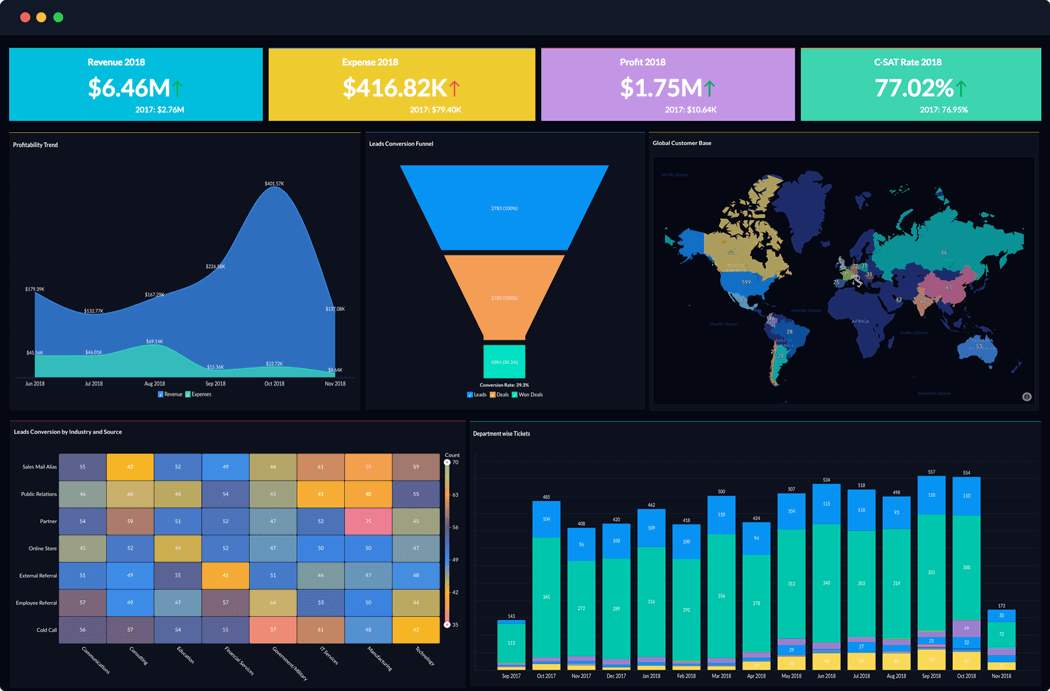
Zoho Analytics is a popular self-service and BI analytics tool that allows you to create dashboards with visually appealing data visualizations that can give meaningful insights. You can get data from a wide range of sources and blend them to create actionable reports and dashboards to track your key metrics, analyze trends, and discover hidden insights. It has an AI assistant, Zia which can come up with suitable answers in the form of reports or KPI widgets for your questions. It can be used in various departments like Sales, marketing, HR, finance and operations to provide real-time visibility into the various aspects of the business through the reports.
The reports can be shared with tailored access control for each user and can also be published on a website.
Pricing: Starts at $25/month
10. Browsee
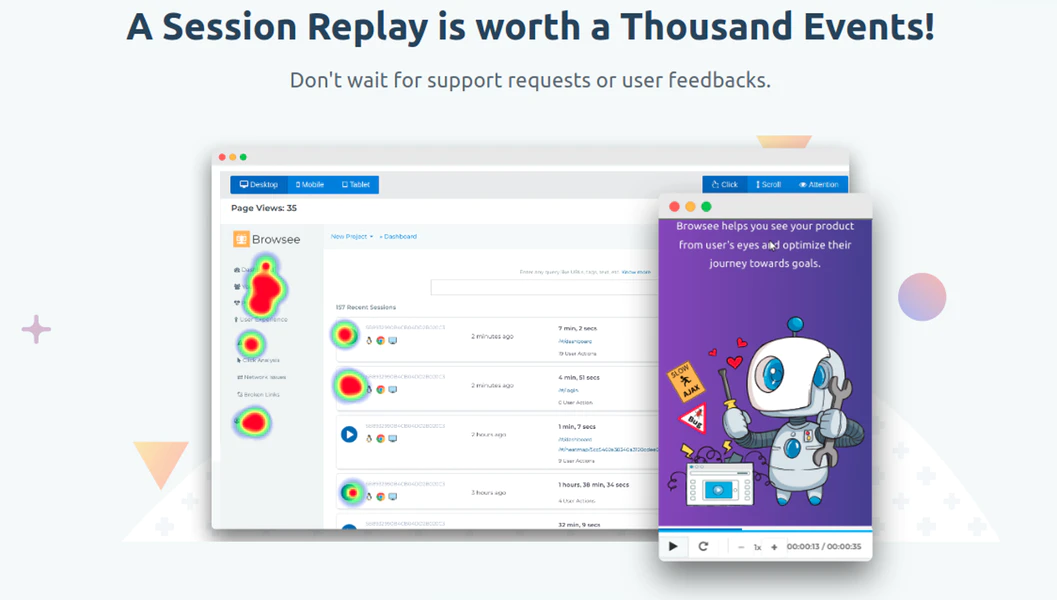
Browsee is a conversion optimization tool for websites that enable you to track your users’ behaviors and monitor their actions to get valuable insights. Browsee’s top-notch tools for crowd animation, Session replays, and heatmaps help you visualize how users navigate through your website and get answers to your user behavior questions rather than going by assumptions. It has advanced AI-based session tags that can help you watch sessions that matter to you only.
Browsee also offers tools for funnel analysis where you can identify and analyze dropped sessions and you can also get daily funnel analytics reports to your mailbox. Browsee also has error reporting functionality where you get notified of any bugs or errors on your website whenever a user encounters it. Here are a few things that browsee can let you know:
- Identify what users like on your website.
- Impact of your new features
- What issues users face and how you can reproduce them?
- Why users abandon your carts or website?
- Which elements of your landing page get maximum customer engagement?
It's easy to use interface lets you get started with your web analytics in a few minutes to uncover a multitude of insights on user behavior that can really help improve your website conversions by taking appropriate actions.
Pricing: Basic - Free and paid plans start at $19/month
Analytics tools are a must-have these days to gain data-driven insights and take meaningful actions based on it. The use of right tools can really make a lot of difference to the products you build, your actions and its impact. Do check these tools so that you don’t miss out on the benefits of analytics!
How much is a great User Experience worth to you?
Browsee helps you understand your user's behaviour on your site. It's the next best thing to talking to them.

