Metrics in Microsoft Azure
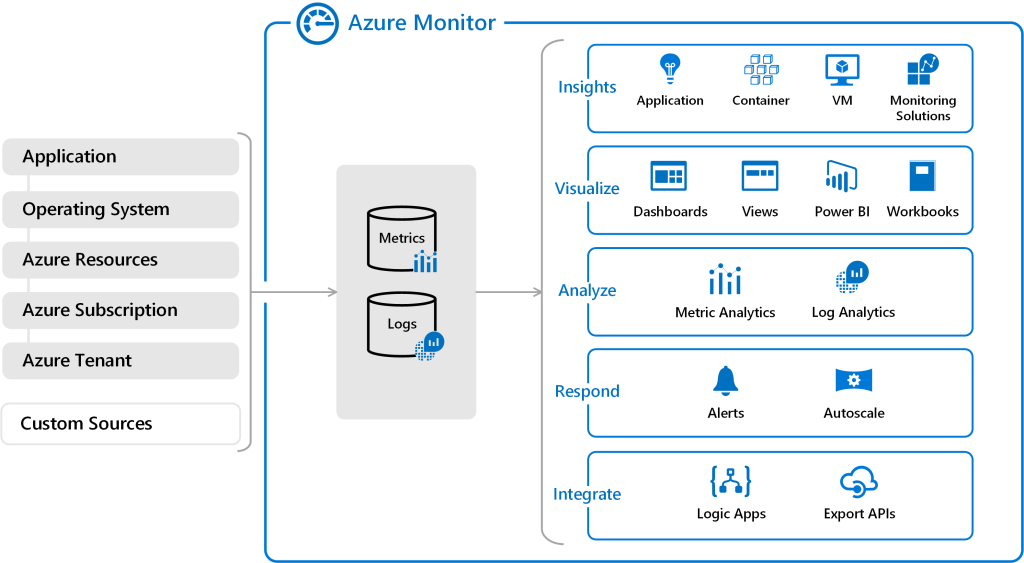
Azure Monitor is the unified resource in Microsoft Azure for the collection, evaluation, and tracking of logs and metrics from a number of sources. Azure Monitor is a managed provider for operating with large-scale telemetry data, providing you with the functionality to create alerts and automatic responses based on metric thresholds and different calculations.
The teams at Microsoft work closely with Azure Monitor and make metrics from its particular products to be used as platform metrics. Do you want to know how many request units a Cosmos instance is using? Or how many dead letters do you have on a service bus topic? No problem; there are metrics available that you can visualize and alert on with the minimum effort from your engineering team.
Important Azure metrics to monitor
Keeping track of these metrics allows you to maintain your Azure app’s overall performance, availability, and efficiency.
Availability
Availability assures your cloud workload has a consistent 24x7 uptime year-round—the first and most critical metric in cloud systems. It’s critical to create and implement an approach that enables you to automatically screen individual services, assets, and the complete workload.
With compute workloads, you ought to monitor your servers by making sure that your virtual machines (VMs) maintain uptime in the specific subnets and resources groups. It’s additionally crucial to watch the state of your app services and make certain that your APIs, back ends, and automatic services aren’t experiencing downtime.
Storage services are essential to cloud systems. Monitor those services to make sure they’re available and might acquire and dispense data to different Azure services, consisting of load balancer front-end pools, web apps, and more.
Additionally, you need to continuously monitor Azure networks and subnets, which join different services and sources within Azure. These encompass interconnecting peers, ExpressRoute for connecting to on-premises networks, application gateways, and cargo balancers.
Administrators of Azure systems need to ensure these network components are constantly running without fail. When your Azure networks are in the best health, you can quickly transfer records within networks and block unwanted access to network components.
Some good practices for monitoring availability consist of:
- Drilling down in granularity: Know what’s available and not through collecting data from each monitored resource. This enables you to pick out sources that are unavailable and the reason for the downtime. Then, you can restore your apps performance when downtime and problems arise in production.
- Setting up alerts: These can tell you when system components become unavailable and the app does not work properly for your end users. For example, you may install some alerts when a VM is consuming excess CPU.
Storage
Azure storage services include the Azure Files dispatched to messaging queues in Azure Queues, NoSQL stores in Azure Tables, Azure disk volumes connected to compute virtual machines, and blob objects in Azure Blobs. These storage and data management solutions ought to maintain 100% uptime for the cloud's record processing and storage processes to run efficiently.
Monitor the following metrics to monitor your use of Azure storage services:
- Storage availability: How many configured storage services are available for storing and accessing records. Unavailable storage resources imply the application can’t save the data accumulated from the user and system.
- Storage usage: This tracks the upper and lower limits of your utilization per time to determine the average usage of the storage services per time. It makes sure you know the way your application uses storage answers for 100% uptime and user availability.
- Storage scalability: This tracks the storage’s responses to increasing the data capture and request rate while maintaining transactional integrity. The capacity to extend to fulfill application storage requirements means your users won’t experience errors or crashes when the software needs to preserve their data.
Some good practices for monitoring storage and enforcing optimizations are:
- Setting alerts for unusual activities, like a sudden exponential growth in storage consumption. This way, you’ll be notified when your system is under potential attack or when there’s an increase in user activity.
- Stopping and deleting idle resources to free resources for different tasks. This saves costs and improves overall performance.
Networking
Azure networking includes virtual networks. A virtual network comprises one or more IP ranges inside an Azure subscription and a particular region. It can’t span areas or subscriptions. The network IP address area incorporates subnets that house computing, storage, and different other resources.
You can easily connect resources within a network. IP address route tables, network interfaces, network security groups, and application security groups, that can connect resources inside a network. However, you may connect to other virtual networks through the use of peers, digital private networks, ExpressRoute, provider endpoints, Azure Private Link, Azure Load Balancer, and network appliances.
Important metrics to monitor in Azure networking systems consist of:
- Network availability: the uptime while network services and background components are available for the software to supply content and functions.
- Network responsiveness: How speedily a network responds to the received requests for information and messages. This, in turn, gives insights into how quickly the software receives data and responses from the backend for users.
- Network throughput: The bandwidth in the network and the amount of information exchanged among the source and destination endpoints inside the network. Essentially, it informs you about request and response data from the software shifting around within the network.
- Network usage: How the software makes use of the network connection.
- Network capacity: Whether modern network assets can resist load before reaching limits. With sufficient network capability, the application will be fully functional and performant.
Best practices for tracking those network metrics and optimizing your packages consist of:
- Setting up alerts to get notifications concerning issues for your networks, such as when network latency is above 500 ms.
- Diving deeply into issues when you get indicators or observe an anomaly for your network links. Check individual links to discover the cause of the problems and fix them quickly.
Response rate
While availability is crucial, software performance calls for high responsiveness as well. Consequently, the response rate metric is the second most essential metric for cloud environments. It describes the time your Azure cloud components and sources take to respond to user and system requests associated with computing, storage, and networking.
- Compute: You must understand how quickly your Azure Virtual Machines and Azure Virtual Machine Scale Sets (VMSS) can respond to power applications and code hosted on them.
- Storage: Knowing the rate of transport of your storage assets allows you to determine when to modify access stages concerning availability and latency.
- Networking: Fast network connections are critical for record transfers across your virtual networks. Insights into the response rate of your network inform decisions about how to connect the resources and network devices for a higher response rate.
- Understanding the response rate enables you to discover optimization possibilities. This permits you to deliver a faster, more responsive experience to your customers and team.
Best practices for tracking your reaction rate and optimizing your software are:
- Study developments within the responsiveness of individual resources. Then, take actionable steps to enhance redundancy and upload more instances to zones or geographical regions to suit application needs. You’ll know which resources to work on to make the software quicker for end-users.
- Configure a threshold for alerts when the response rate becomes too slow. This informs you about the compute potential or network strength when resource usage peaks and users struggle to load web pages or use software functionalities.
Processing potential
How reliably your VMs, Virtual Machine Scale Sets (AVMSS), and other compute services perform drives the overall IT operations that you and your users enjoy. You must constantly monitor your compute instances and servers to ensure 100% uptime.
Metrics to monitor processing ability encompass:
- Server availability: This measures the time percent of the uptime of your VM and compute services. 100% uptime is the appropriate server availability measure; that means anything much less than ninety-nine percent needs improvement.
- Server capacity: the server and compute ability used at a point in time and the closing capability of the total available length. Lower CPU/memory means the application begins to lag in overall performance.
- Server usage: This measures the proportion of the available computing and processing capacity used at a particular time. This metric can be used to determine the trend of your software performance based on how much power of the server processing it computes.
- Server responsiveness: This measures the speed at which computing services and servers reply to requests from different services within or out of the network wherein they’re stationed. This metric will let you decide the server speed, which defines the application's overall performance.
- Server scalability: This metric measures how well your compute system expands in terms of I/O speed, processing capability, and memory capability to address the growing demand for processing capacity. This metric tells you the way your server can handle improved application overall performance demands.
Best practices for tracking these metrics and enhancing your application based on these metrics include:
- Setting up end-to-end visibility into the operations of your computing and processing services. Sufficient data and visibility assist you in debugging overall performance errors easily without leaving any stone unturned. It also saves time while solving issues that cause downtime.
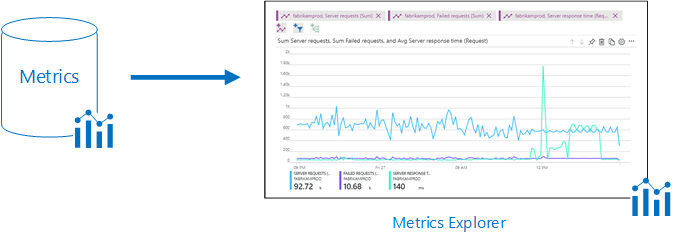
How to explore the Azure metrics
The Azure web portal has integrated monitoring functionality for viewing and alerting on performance metrics. You can graph any of the metrics available in Azure and set easy alert guidelines to send email notifications when metrics exceed the minimum or maximum thresholds.
Enabling Azure VM monitoring
Azure’s Diagnostics extension may be enabled while you create a new virtual device via the Azure web portal. But even if you disabled Diagnostics while creating a VM, you could turn it on later from the “Settings” menu inside the VM view. You can pick out which metrics you desire to accumulate (basic metrics, network, and internet metrics, .NET metrics, and many others) in the Diagnostics tile as well. You will need to link the VM to an Azure storage account to view your diagnostic data.
Viewing Azure metrics within the web portal
Once monitoring is enabled, you will see numerous default metric graphs when you click on them in your VM within the Azure portal. Clicking on any tracking graph opens a larger view, in addition with two critical settings options: “Edit chart,” which lets you select the metrics and the timeframe displayed on that graph, and “Add alert,” which opens the Azure alerting tile.
Adding alert regulations
In the alerting tile, you may set alerts on Azure VM metrics. Azure alerts can be set against any upper or lower threshold and will alert every time the selected metric exceeds (or falls under) that threshold for a fixed quantity of time.
Accessing raw metric data in Azure storage
Because Azure metrics are written to storage tables, you can access the raw data from Azure in case you need to use external tools to graph or analyze your metrics. The most common way is to gain access to metrics via Microsoft’s Visual Studio IDE; however, you could also copy metric data tables to local storage with the use of the AzCopy application for Windows, or you may access metric data programmatically using the .NET SDK. Note that the Azure command-line interface, which is available for Mac, Linux, and Windows, will permit you to view the listing of tables in your storage accounts (through the Azure storage table listing command), but not the real contents of these tables.
Connecting to Azure in Visual Studio Cloud Explorer
Starting with Visual Studio 2015 and Azure SDK 2.7, you may now use Visual Studio’s Cloud Explorer to view and control your Azure assets. (A similar function is available using Server Explorer in older versions of Visual Studio; however, not all Azure assets can be reached.)
To view the Cloud Explorer interface in Visual Studio 2015, go to View > Other Windows > Cloud Explorer.
Connect to your Azure account with Cloud Explorer by clicking on the gear and entering your account credentials.
View stored Azure metrics
Once you have signed in to your Azure subscription, you'll find your metric storage listed under “Storage Accounts" or “Storage Accounts (Classic),” depending on whether the storage account was launched on Azure’s Resource Manager stack or on the Classic Stack.
Metrics are stored in tables, the names of which generally begin with “WADMetrics.” Open up a metric table in one of your metric storage accounts, and you will see your VM metrics. Each table consists of 10 days' worth of data to prevent any table from becoming too large; the date is appended to the end of the table name.
Using stored metrics
The name of your VM can be seen at the end of each row’s partition key, which is useful for filtering metrics when multiple VMs share the same metric storage account. The metric type can be found inside the CounterName column. To export your data for use in Excel or any other analytics device, click on the “Export to CSV File” button on the toolbar just above your table.
How to create a dashboard in Azure Monitor
In your Azure Portal, a default dashboard is available that you may edit and customize. You can also create additional dashboards for personal use or to share with others through role-based access controls (RBAC).
Using RBAC, you could give permissions on the subscription, resource group, or resource level. This allows you to specify that users have access to a single dashboard (a resource), a cluster of dashboards, or any dashboard created on your account. Within those levels, you may additionally assign roles that include reader, contributor, or owner. These roles decide whether or not customers can view, modify, create, or delete dashboards.
Creating a New Dashboard
After you have evaluated the default dashboard options, you have to begin making custom dashboards for extra productivity.
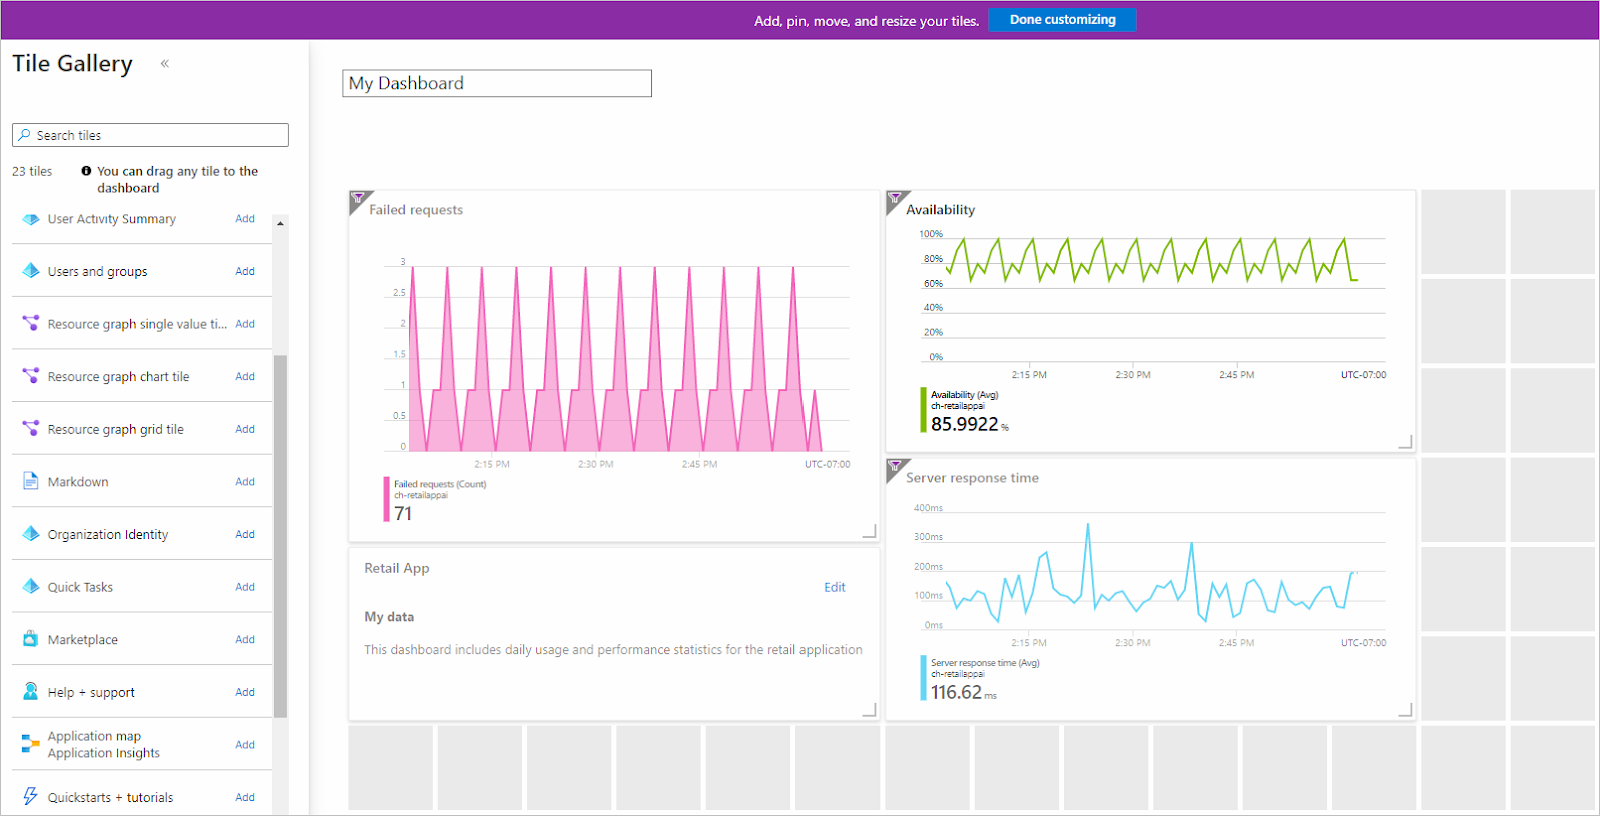
1. From the Azure Portal, pick out Dashboard.
2. Click New Dashboard to open the Tile Gallery.
3. In the workspace, upload any tiles you need to include to your dashboard and name your dashboard.
4. Once you're done, click on Done Customizing. You can now view your custom dashboard.
Publishing a Dashboard
After your custom dashboard is created, you need to share it with your users. This calls for publishing the dashboard.
1. From the dashboard you want to submit, click Share in the toolbar.
2. From the Sharing + access control screen, confirm your subscription name, and choose which team you want to post to. Dashboards are posted by default to the ‘dashboards’ useful resource organization; however, you could define any other organization by unchecking the default box. When finished, click Publish.
3. Assuming that your inherited subscription permissions are correct, your dashboard is shared. If you need to personalize permissions, you may accomplish that via the Sharing Access + Control display screen by deciding on Manage users.
Conclusion
This article explored the metrics to monitor, how to discover them, and a way to create a dashboard. Metrics offer observability and insights into the state of your Azure cloud infrastructure. When properly tracked and analyzed, they help you predict and prevent downtime and resource failures.
Monitoring devices like Azure Monitor make it easy and sustainable to track metrics. These AI-driven analyses will guide you to better decisions and actionable, metric-driven steps to enhance your app’s performance.
How much is a great User Experience worth to you?
Browsee helps you understand your user's behaviour on your site. It's the next best thing to talking to them.

