How to use React developer tools?
One of the most valuable abilities a developer can have is debugging. It enables you to navigate correctly, identify errors in your code, and quickly and effectively apply fixes to produce software systems that are production-ready, error-free, and of a high calibre. Several tools and techniques make This possible in the modern web development industry.

One of the most rapidly expanding front-end development libraries is React. Providing a component-oriented UI development approach makes creating intricate and interactive UIs simple. And it has React Developer Tools, a debugging tool, just like other UI development frameworks and libraries.
React DevTools: What is it, and how does it work?
React Developer Tools is a browser plugin that offers React-specific debugging tools. It can be downloaded as a standalone app, Chrome, or Firefox extension.
It lists all of the root React components rendered on the page and their corresponding child components from each source. You can use this information to
- Check if your props are getting passed down correctly
- If the child components are the ones you expect them to be.
- If the component state and props are changing as per the expectations.
Why should you use React Developer Tools?
Every contemporary web browser has built-in developer tools that allow programmers to examine and correct bugs in web applications. For instance, you can add breakpoints and debug any JavaScript-based application using the console. Also, the DevTools of the browser make it simple to inspect native DOM elements and attributes.
However, We cannot use built-in browser developer tools to debug React-component-specific issues because React uses a virtual DOM with component instances and renders the real DOM during component rendering phases.
By enabling you to inspect and manipulate React component internals, including props and state, React Developer Tools allows you to debug your React applications. By eliminating the need for console.log browser-native workarounds, using React Developer Tools speeds up your debugging of React apps.
Features of React Developer Tools
Now that you have understood how the React Developer Tools solution aids React app debugging and why the built-in debugger of a web browser is ineffective take a look at the following features that React Developer Tools have highlighted:
- Examining the React component tree and observing the browser's reflection
- Components for searching and filtering in sophisticated apps
- Real-time monitoring and modification of props and state to observe component behaviour
- Finding component owners (also known as parents and ancestor components) in unfamiliar apps
- Provides a method to pause a React component so that you can test the fallback component
- Provides a fully functional profiler with a flame and ranked graph to implement performance improvements.
- Supports exporting and importing profiler results for requirements involving cooperative debugging (teammates do not need to see screenshots or recordings from the profiler)
Installation
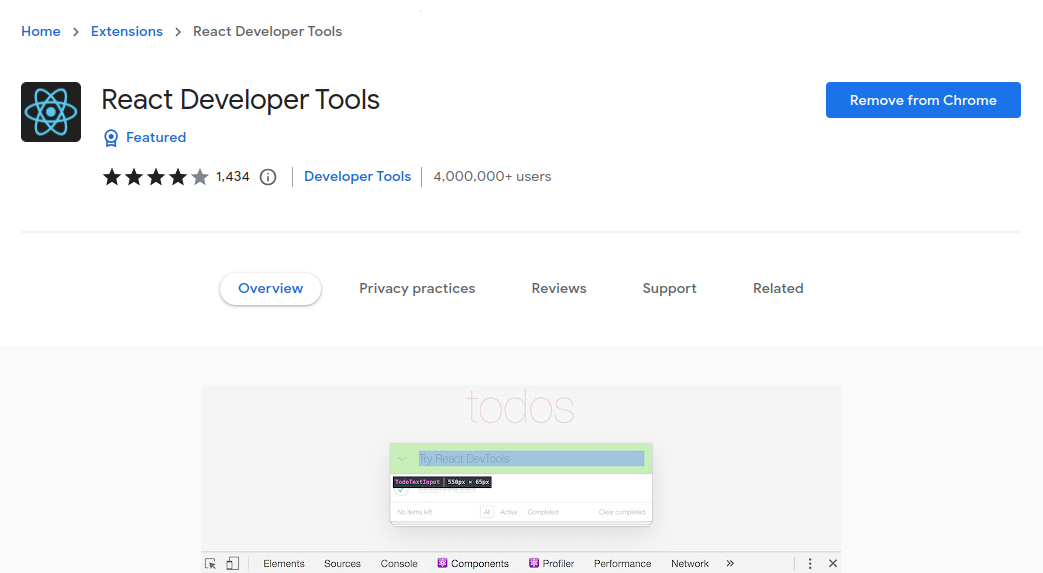
You can go to the Chrome Webstore to install it
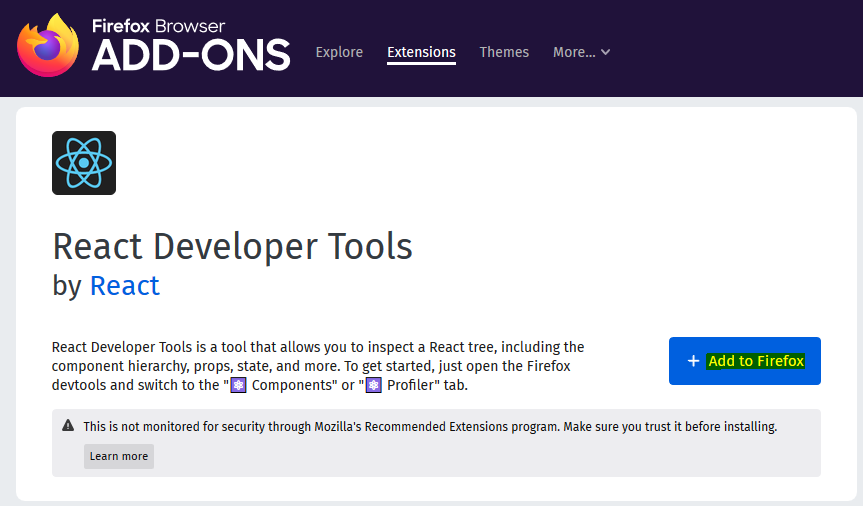
Or if you are using Firefox, you can go to their app store.
The DevTools can be installed as a standalone app using the following command if you use a browser other than Chrome or Firefox.
You can download the standalone version from npm if you use React Native, Safari, or another web browser:
npm install -g react-devtools
# --- or ---
yarn global add react-devtools
# --- or ---
npx react-devtools
When inspecting a webpage in the browser after installation, two new tabs, Components and Profiler, appear. Both tabs are grey if you are on a page without React components. You will see blue or green components if it has React components.
Components tab
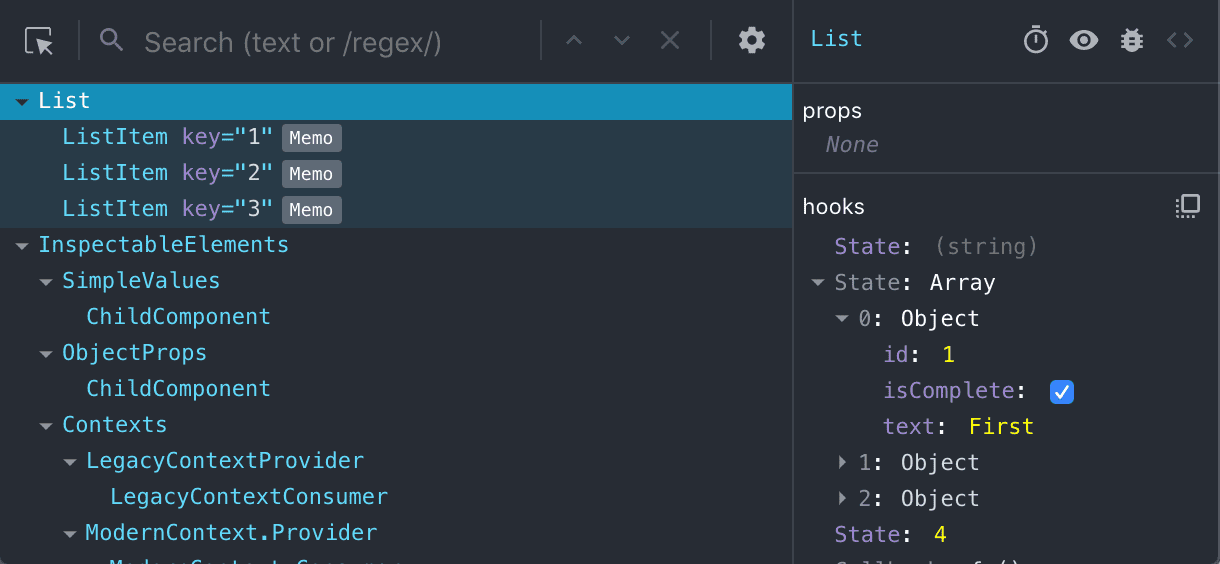
DevTools' extensive component tree navigation was a little challenging in earlier versions. The current React component tree, and any props, states, or contexts, are shown on the Components tab, which has been added. Additionally, it enables you to filter out components and hide those in which you have no interest.
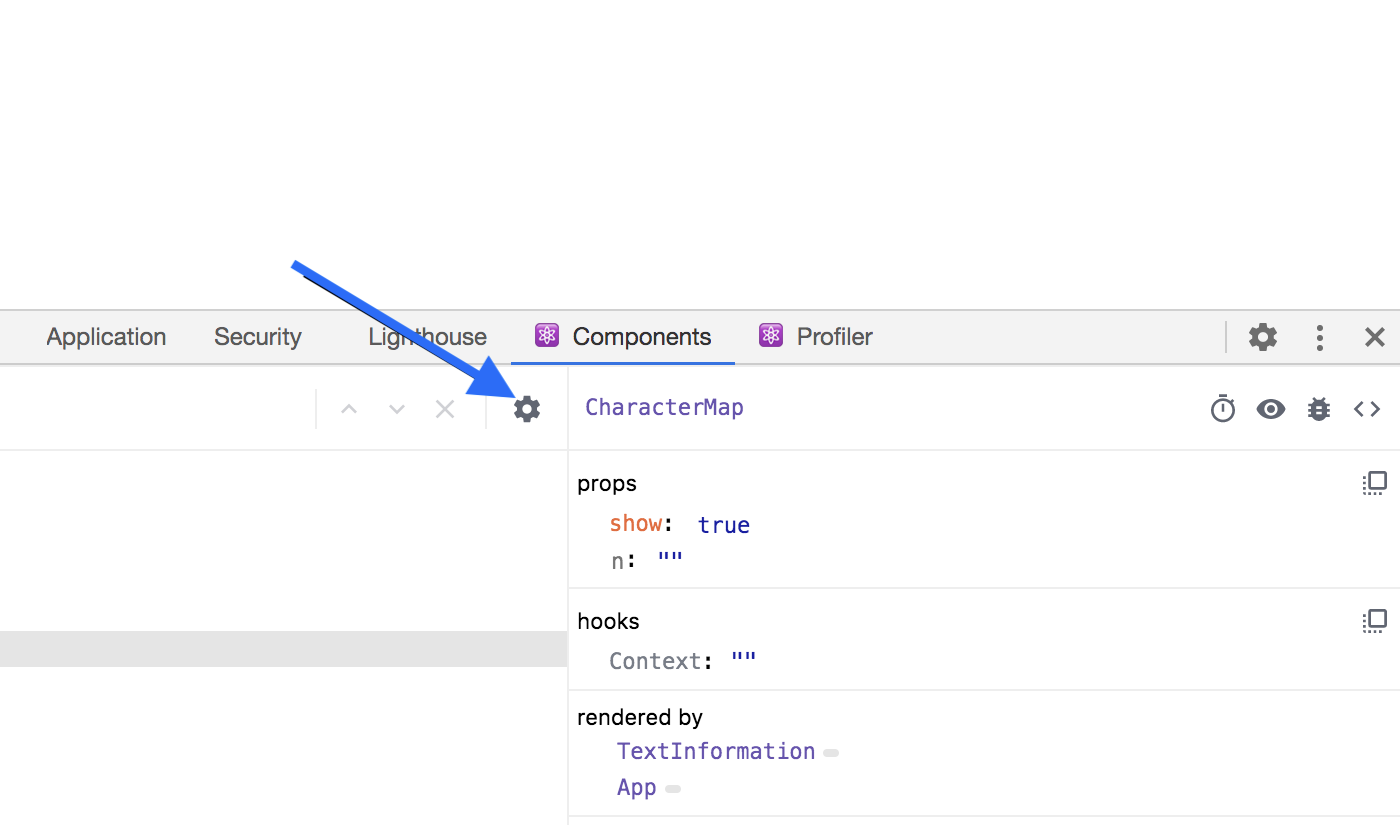
Select a component to see this functionality in action. The props, state, and hooks of that component will be shown on the right side of the console.
Any HTML element in the browser can have its corresponding React component highlighted by hovering over it. You can also select the arrow button in the leftmost tab by clicking on an HTML element to open the tree and select the appropriate React component.
DevTools adjusts nested indentation dynamically
In an earlier version of React DevTools, deeply nested components required vertical and horizontal scrolling, making it challenging to track large component trees. To prevent horizontal scrolling, DevTools now dynamically adjusts nested indentation.
Restore the last element selected
DevTools restores the last selected element to its default state by clicking Reload while debugging.
Functions
React DevTools has a useful option for you if you are looking for a specific function, like a click handler or a callback function. Right-clicking a function in the props or state overview will enable it as a global variable.
Improved hook support
In version 4, hooks now provide the same support as props and states, accelerating and simplifying React app debugging. You can alter values and delve deeper into arrays, objects, and other things.
Profiler tab
You can measure component rendering and record interactions using the Profiler tab in React Developer Tools. With a new "reload and profile" section, this feature is helpful when debugging a complex system.
It can record the time it takes for each render, component rendering, and re-rendering. When assessing the performance of specific components, this list can be used to jump between commits quickly.
To use the profiler, follow these steps:
- Start by visiting a website created with ReactDOM's profiling build.
- Then, click the red circle to begin recording a session.
- Perform a few actions within the programme.
- Finally, to end the session, press the circle once more. Timings specific to each component should therefore appear.
Enabling a highlight when a component is re-rendered is a useful way to understand how components interact. Through this, You will see how the components respond to data changes.
Step through parents
In the most recent version of React DevTools, you can quickly debug an unexpected prop value by tracking the history of a specific prop. The right pane displays a rendered-by option list to move quickly through the owners list while debugging. By clicking on a child component in our app, we can see the parent component that renders that component.
The owners' tree is an additional inverse function available in React DevTools. It is a list of the objects a specific component produces. This is a great way to familiarise yourself with complicated React apps of this size. To view the owners' tree, double-click a component. Then, click the x button to return to the entire component tree. You can also navigate through the tree to see all children of a component.
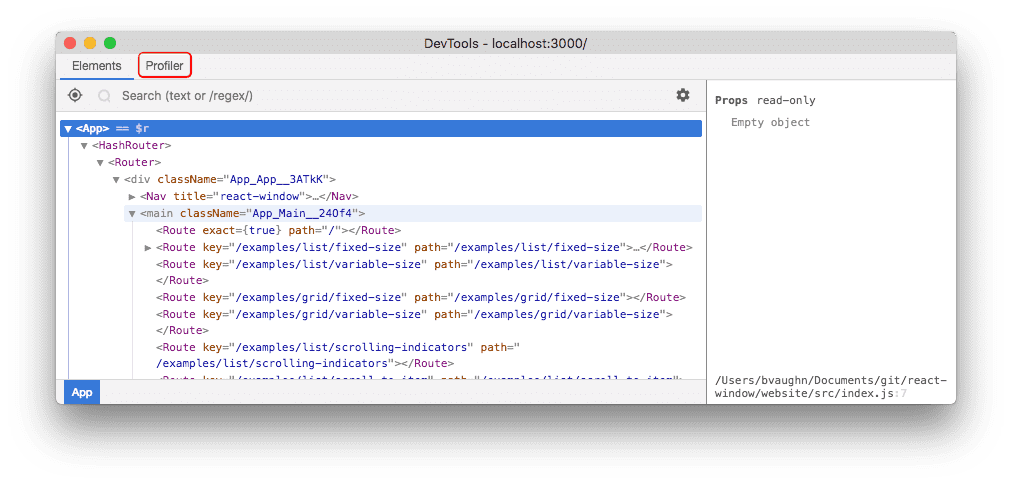
Get access to components and states on the console
Even though React DevTools makes it simple to find and fix most bugs, there are some instances where console.log debugging is preferable. Direct communication with component instances is now possible from the console.
Selecting a component in React DevTools will open the console; pressing the escape key will show both components at once. Then enter $r to retrieve an instance of that React component from the console.
Jump into the source view
All JSX elements have the source property added by a plugin that is part of Babel. Now that the Babel plugin is supported, you can go straight to the source view of the browser and examine, modify, and set breakpoints for the code. The application runs smoothly in development mode, despite a slight slowdown.
Add babel-plugin-transform-react-jsx-source to your .babelrc file after installing it. To use this feature, restart your development server after that. When you right-click a component in the component tree, you will see a new choice: Show component name> source.
Tracking interactions
React DevTools supports interaction tracking. This programmatic API enables you to categorise and monitor the effectiveness of various app events. Button clicks, for instance. It would be beneficial to trace these events to learn the timing of these events and the underlying reasons for some delayed commits.
Please be aware that React 17 will remove this API.
Monitoring and testing the effectiveness of your website
This guide explains how to use React Developer Tools, a crucial browser add-on for debugging and optimising your React apps. Browsee is a specialised tool for you if you want to continuously monitor your web app’s performance and Google's Core Web Vitals.
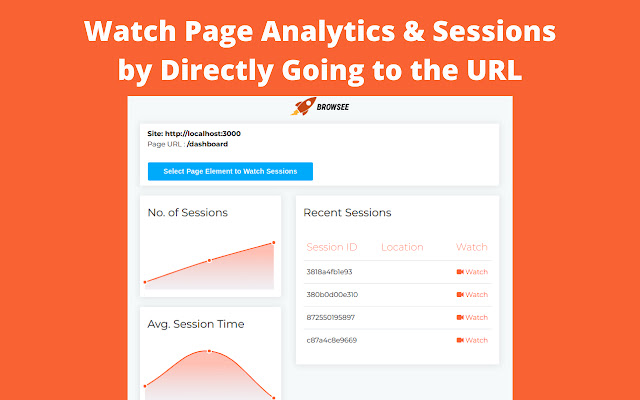
In addition to providing over 70 performance metrics and any unique user timing metrics you have set up for your site, Browsee tests the speed at which your website loads. Along with seeing the results of your optimisations, you will receive advice on making your website load faster. Optimise website speed, SEO, and conversion rates with Browsee.
Conclusion
React Developer Tools is a powerful debugging tool that significantly enhances the development experience for React applications. Developers can easily identify and resolve issues in their code by providing a dedicated interface to inspect React component trees, props, states, and hooks. The Profiler tab offers valuable insights into component rendering performance, allowing developers to optimise and fine-tune their apps for better user experiences.
With the ability to pause components, search and filter, track interactions, and navigate component hierarchies, React Developer Tools simplifies the debugging process and accelerates the development workflow. The tool's integration with the browser's console enables direct communication with component instances, further facilitating debugging when console.log is preferred.
How much is a great User Experience worth to you?
Browsee helps you understand your user's behaviour on your site. It's the next best thing to talking to them.

