Exploring the Top Heatmap Libraries for React: Adding Visual Insights to Your Data
In the world of web development, presenting data in a visually appealing and informative manner is crucial. One powerful way to achieve this is through heatmaps, which provide a dynamic representation of data density and patterns.
Heatmaps are particularly effective in conveying complex information through color variations, making them an essential tool for data visualization. In this blog post, we'll dive into some of the best heatmap libraries for React, enabling you to choose the perfect tool for your project.
What are Heatmaps?
Heatmaps are graphical representations that visualize the distribution and depth of information factors on a two-dimensional surface. Heatmaps often use coloration gradients to depict the attention of values in fields like information analysis, geography, and person journey design.
The hotter colors, such as pink or orange, signify excessive values or density, whilst extra terrific colors, like blue or green, point out decrease values or sparser areas. This visible method shortly identifies patterns, trends, and areas of hobby inside massive datasets. Heatmaps provide intuitive insights, making them treasured equipment for decision-making and verbal exchange in a number of industries.
Benefits of Using Heatmaps
Here are some key advantages:
Instant Insights:
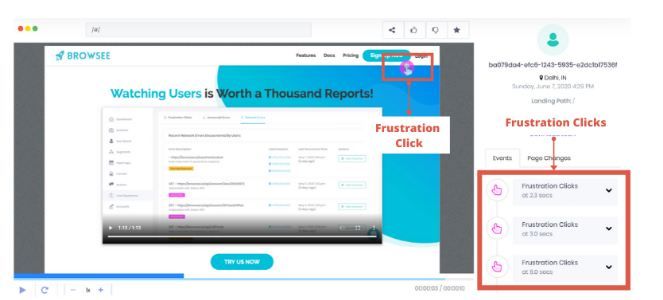
Instant insights are a treasured advantage of heatmaps, supplying an instantaneous visible illustration of data. These graphical overlays divulge real-time trends, consumer behavior, and hotspots, helping speedy decision-making. Heatmaps grant actionable Genius via showing data such as click-through rates, navigation patterns, and engagement levels.
This immediacy enhances person journey optimization, internet site design, and content material placement. In the fast-paced digital landscape, these instantaneous insights from heatmaps empower corporations to make knowledgeable changes swiftly, main to better conversions and normal performance.
User Behavior Analysis:
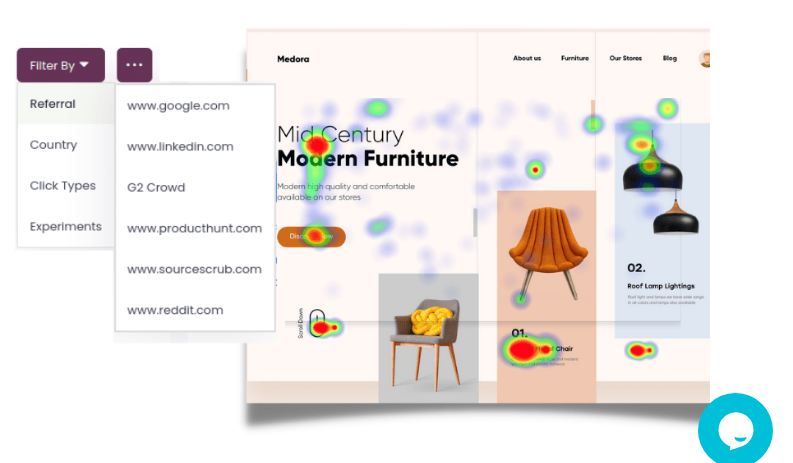
User Behavior Analysis thru heatmaps gives useful insights into how traffic have interaction with a website. Heatmaps visually spotlight the areas attracting the most attention, clicks, or engagement. This facts helps corporations optimize layout, content material placement, and calls to action.
By appreciation person preferences, ache points, and navigation patterns, agencies can beautify person experience, main to greater conversions and elevated usability. Heatmaps empower data-driven decision-making, permitting non-stop refinement of the digital presence for most consumer pleasure and, ultimately, enterprise success.
Data Density Representation:
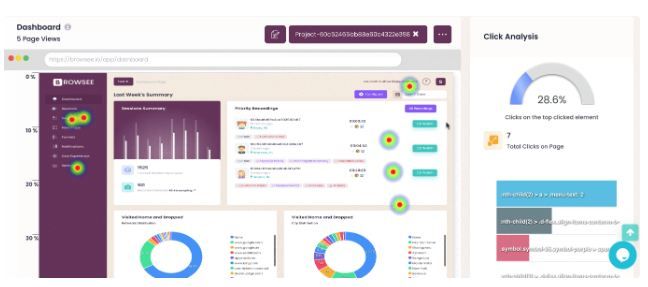
Data Density Representation is a full-size gain of Heatmaps. Using coloration depth to depict the attention of records points, heatmaps provide a visible perception into patterns, hotspots, and tendencies inside massive datasets.
This strategy approves for rapid data distribution comprehension, helping decision-making and figuring out areas of interest. Whether in geographic analysis, person conduct tracking, or scientific research, the capacity of heatmaps to show statistics density with readability makes them a treasured device for extracting significant insights from complicated datasets.
A/B Testing:
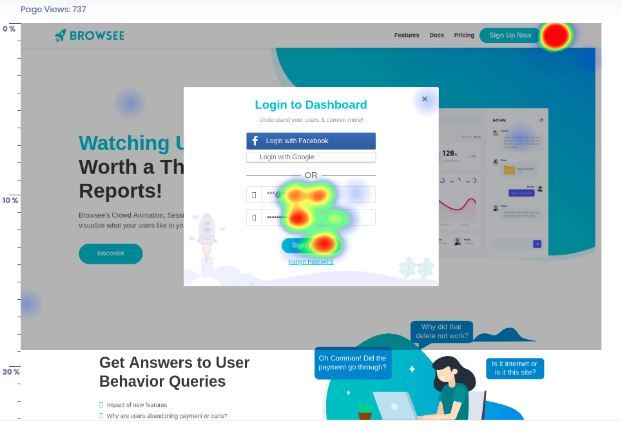
Heatmaps supply a treasured gain in A/B testing. They visually spotlight person interactions and conduct on a net page, revealing which factors appeal to interest and engagement. This records helps entrepreneurs and designers make knowledgeable choices for the duration of A/B tests, as they can pinpoint precise areas for optimization.
By inspecting heatmaps, groups can refine their hypotheses, goal modifications extra effectively, and eventually beautify person experience, enhancing conversion costs and ordinary internet site performance.
Efficient Problem Identification:
Heatmaps are valuable equipment for environment friendly trouble identification. By visually representing statistics thru shade gradients, they spotlight patterns, trends, and anomalies inside a dataset. This permits swift detection of areas that require interest or improvement, whether or not in internet site consumer interactions, product usage, or scientific research. Heatmaps supply a complete overview at a glance, assisting decision-making, aid allocation, and optimization efforts.
Communication Tool:
Heatmaps are a effective conversation device through visually synthesizing complicated facts into effortlessly comprehensible patterns. They allow stakeholders to rapidly draw close person behaviors, interactions, and preferences on a internet site or app.
This intuitive illustration allows collaboration between designers, marketers, and developers, making sure a shared appreciation of consumer engagement. Heatmaps streamline communication, permitting groups to make data-driven decisions, optimize person experiences, and decorate conversion rates.
The Top Heatmap Libraries for React
Among the many heatmap libraries, right here are the pinnacle heatmap libraries for React that you can pick out from:
#1 React-Heatmap
React-Heatmap is a treasured device for visualizing records dynamically and interactively inside React applications. This open-source library seamlessly integrates heatmap functionality, permitting builders to show records density patterns or consumer interactions on a person interface.
React-Heatmap highlights areas of activity the usage of customizable coloration gradients, making it perfect for a variety of use instances like internet site person conduct analysis, geospatial records representation, or even real-time statistics visualization. With its easy-to-use API and React thing structure, React-Heatmap empowers builders to create attractive and informative visualizations, bettering person experiences and assisting in data-driven decision-making whilst seamlessly becoming into the React ecosystem.
#2 React-Leaflet-Heatmap
React-Leaflet-Heatmap is a treasured integration for net mapping functions constructed with React and Leaflet. It combines the strength of React, a famous JavaScript library for constructing consumer interfaces, with Leaflet, a extensively used mapping library. The Heatmap plugin provides an vital layer, enabling visualization of statistics depth via colour gradients, making it ideal for showing spatial trends, concentrations, or consumer interactions.
This dynamic plugin is customizable and efficient, rendering massive datasets whilst imparting interactive and responsive maps. React-Leaflet-Heatmap simplifies developing informative and visually attractive heatmaps inside a React environment, improving the presentation and evaluation of geographic data.
#3 Reaviz
Reaviz is a dynamic information visualization library that empowers builders to create stunning, interactive, and informative visible representations of data. With a large vary of customizable charts, graphs, and maps, Reaviz makes it common to deliver complicated statistics visually compellingly. Its flexibility permits seamless integration into net applications, imparting customers with enticing experiences.
Whether it is line charts, bar graphs, pie charts, or greater specialised visualizations, Reaviz simplifies the process. Developers can successfully talk insights, enabling higher decision-making and understanding. Reaviz's robust features, accessibility, and ease of use make it a treasured asset for every person in search of to free up the energy of information visualization.
#4 Victory
Victory, a end result of effort, embodies triumph over adversity. It's a testomony to determination, skill, and resilience. Beyond the floor of occasion lies a profound experience of accomplishment, motivating in addition pursuits. Victory can be personal, conquering one's fears or limitations, or collective, uniting a team, community, or kingdom in a shared win.
It embodies the human spirit's wish to excel, the force to attain higher, and the pleasure of reaping the rewards of difficult work. It's a reminder that challenges are opportunities, and with unwavering commitment, we can overcome, inspiring others with the sweet style of achievement.
#5 Uber's Deck.gl
Uber's Deck.gl is a ultra-modern statistics visualization framework that empowers builders to create stunning, interactive statistics visualizations with most beneficial performance. Built on WebGL, it seamlessly integrates with famous internet frameworks, enabling the introduction of complicated and dynamic visualizations at once in the browser.

Its versatility spans from maps with tricky layers to 3D views, all customizable with wealthy interactivity. Uber open-sourced Deck.gl, fostering a shiny neighborhood and accelerating innovation in the discipline of information visualization. Its power, flexibility, and openness make it a go-to device for data-driven storytelling.
#5 React-heatmap-grid
React-heatmap-grid is a dynamic and versatile heatmap library designed for React applications. It seamlessly integrates with React components, permitting builders to create interactive and visually compelling heatmaps.
With customizable shade scales and tooltips, it correctly visualizes records patterns, making it an precious device for information analysis, consumer conduct tracking, and overall performance optimization. Its responsiveness ensures a steady ride throughout devices, whilst its effortless integration with country administration and facts visualization libraries streamlines development.
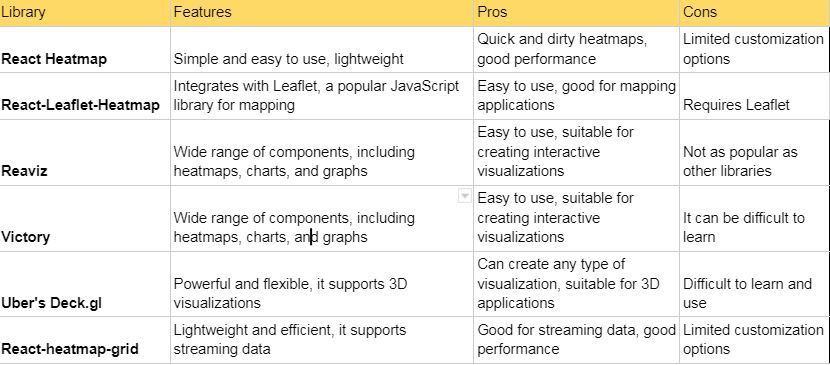
Comparison of the above Libraries in Nutshell:
Factors you need to Consider before Choosing the proper Heatmap library
When choosing a heatmap library for your React application, numerous critical elements have to be regarded to make certain the proper healthy for your project:
Compatibility:
Ensure the heatmap library is well suited with React. It need to combine seamlessly with React factors and work properly inside your React application's ecosystem.
Ease of Use:
Choose a library with a easy and intuitive API. It have to be handy to set up, configure, and use, even for builders with various ride levels.
Customization:
Look for a library that approves you to personalize the heatmaps' appearance, behavior, and information representation. This flexibility ensures that the heatmap aligns with your application's sketch and consumer needs.
Performance:

Consider the overall performance implications of the library. A well-optimized heatmap library must deal with giant datasets successfully except inflicting overall performance bottlenecks in your React application.
Community and Documentation:
A robust neighborhood round the library is beneficial. It ensures ongoing support, worm fixes, and updates. Comprehensive documentation and examples make getting to know and the use of the library simpler for your team.
Features:
Evaluate the aspects supplied through the library. Some libraries may also grant extra equipment like interactive features, records analysis, and help for specific heatmap kinds (e.g., point, density, calendar, etc.).
Integration:
Consider how properly the library can combine with your present facts visualization tools, country administration solutions, or different third-party libraries you might also be the usage of in your React application.
Maintenance and Updates:
Check the library's launch records and frequency of updates. A many times maintained library will probable continue to be well matched with the cutting-edge React variations and provide trojan horse fixes and new elements over time.
Conclusion
Incorporating heatmap libraries in React empowers facts visualization, imparting precious insights into consumer conduct and bettering decision-making. These equipment release the electricity of visible analytics, enabling builders to create extra intuitive person experiences, optimize interfaces, and subsequently pressure higher results. Heatmaps expand React's abilities for data-driven success.
How much is a great User Experience worth to you?
Browsee helps you understand your user's behaviour on your site. It's the next best thing to talking to them.

