D3.js Alternatives
D3.js is short for Data-driven documents, and it's a library in JavaScript that makes dynamic and interactive visualizations of data possible inside web browsers. D3.js works with different standards like... SVG, which stands for Scalable Vector Graphics, along with CSS and HTML5, comes with functions that let people make SVG items.
You can pick elements to style them and even put in moving effects or tips when you hover over things. Google chart, Chart.js, AnyChart, Highcharts, Chartist.js, ZingChart, pixi.js RTCjs and Webix act similar to D3.js. We will talk about these options in the article.
Alternatives of D3.js
Below is a list of D3.js alternatives:
Google chart
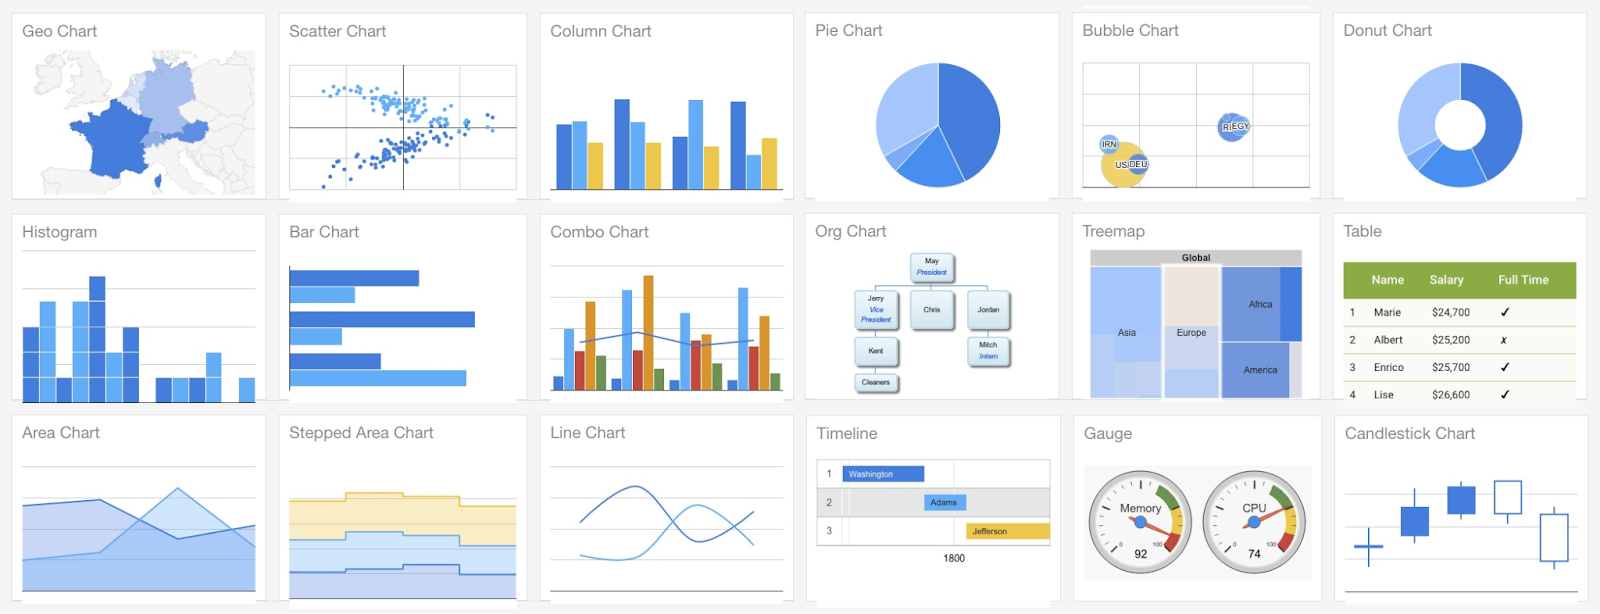
Google serves as an excellent choice instead of D3.js, providing a web-based interactive service to generate graphical charts according to data provided by users. The user provides information and how it should look using JavaScript on a webpage. It cannot use the HTTP way of asking for things, so it does not work with the code for Google's chart service that the user has written. To update user code from Google Chart API to Google Charts, it is necessary to understand HTTP semantics in JavaScript.
AnyChart
AnyChart is a different option to d3.js; it's an interactive chart library for JavaScript made to fit into websites, mobile applications, and desktop programs. It helps show and study data that follows a timeline. It has interactive map graphs like PERT and Gantt charts.
Users can export these maps and share with others. It has many functions like handling large amounts of data, tools for drawing, creating charts, indicators for technical analysis, panels to control information and solutions for business needs. AnyChart can work with a lot of different kinds of charts. An area chart, a box chart, bubble charts, cherry charts, personalized charts, maps with dots, flow maps, error charts; plus there are heat map representations and funnel types. Other kinds include jump line variations and step line designs. Also available from any chart company are sunburst graphics among their selection of visuals.
chart.js
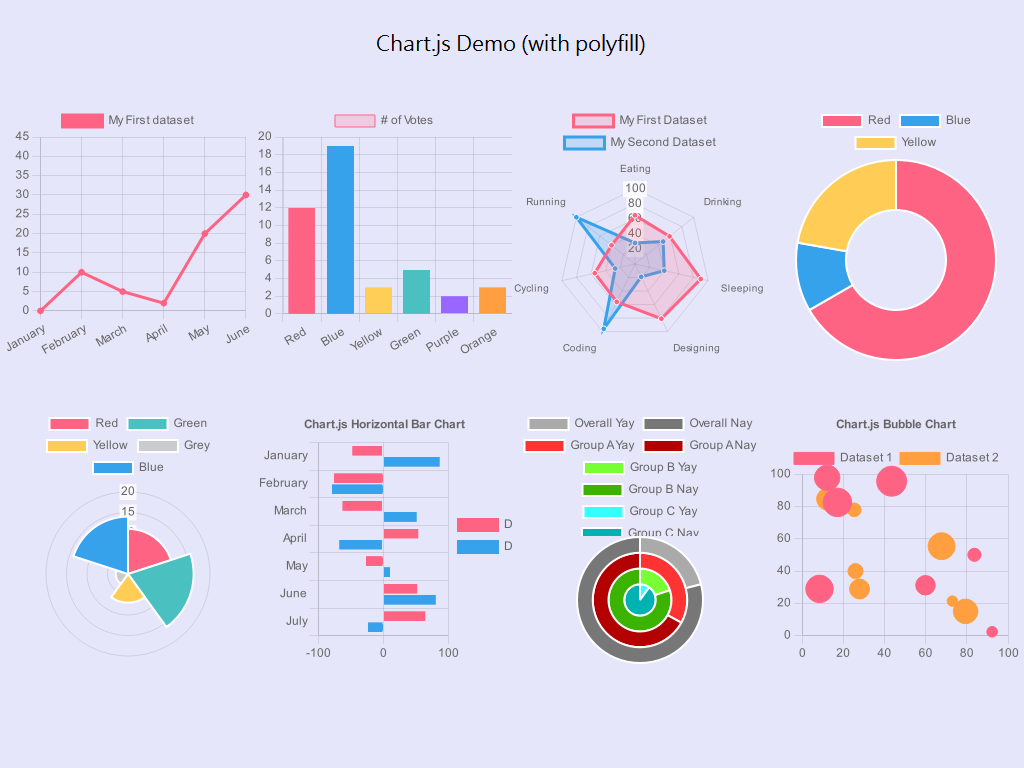
Another option instead of D3.js is chart.js, a JavaScript library that is free to use for turning data into pictures. It can handle 8 kinds of diagrams: bars, lines, bubbles, pies, polars, dots spread out on a graph and charts like the ones you see on radar screens. It shows up in HTML5 canvas on all the new browsers. It's recognized as the top library for showing data visually. It makes it easy to see the difference between data groups. Besides these things, it offers moving pictures too. feature
Highcharts
Highchart is a different option compared to d3.js, which is a JavaScript library used for making charts. It allows you to make interactive charts for web projects with little effort. It makes map charts that you can zoom into and work with by touch. Users can change and design the charts as they like. It supports a robust JavaScript library that builds interactive charts and timelines quickly.
pixi.js
Pixi.js is an engine for creating HTML5 content that uses a versatile 2D WebGL renderer. It's an open-source collection of code that works across different platforms. It arranges the information and items into a tree structure that has parent-child links.
For quick project deployment, pixi.js utilizes Cordova. It lets people make their own WebGL filters and shaders so they can improve their projects a lot. Pixi.js makes the text look very good when it displays it. With Pixi.js, All content can be made to be screen-reader accessible with ease.
Webix
Another option instead of d3.js is Webix, which is a JavaScript library for creating complicated and dynamic web applications that can work across different platforms. It includes many widgets, controls for users with graphics, and tools on the internet like a skin builder and form builder. Webix works together with frameworks and client-side libraries such as Angular, React, Meteor, and Vue.js. Every widget that Webix offers has support for features like drag-and-drop functionality, loading data dynamically, and pagination.
Chartist.js
An additional option instead of d3.js could be chartist.js, a library for charts using JavaScript. This one uses SVG (Scalable Vector Graphics) and takes advantage of the DOM's capabilities to help with some features it has. Its primary purpose is to supply a basic and not heavy library for making charts on your website that can adapt to different screen sizes. Chartist.js gives you the option to use CSS animations and transitions with SVG elements as well.
ZingChart
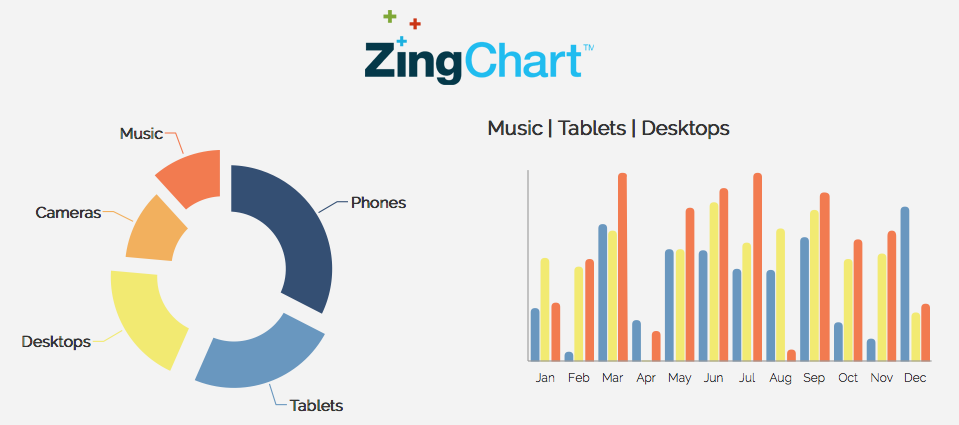
A different option to d3.js is the ZingChart, that makes charts which are interactive and have animations for many data records by using a JavaScript library for charting. It has all tools needed so users can work with the chart, like clicking on data points or making parts of the chart bigger or smaller. ZingChart has a strong API for users to use the chart on their own and add different kinds of charts and styles. It is a library that needs no other dependencies and works with all internet browsers.
RTCjs
RTCjs is a library for JavaScript to make charts in real-time applications and has features for engineering and setting plot values. It has integrated functions like zoom-in, enabling people to apply different types of X-axis labels, ranging from numbers to dates and times.
It also includes a scrolling option that lets individuals move through the enlarged graph. Users have the ability to design their own unique zoom and scroll buttons. It lets users change from automatic zoom to hand control zoom, as well as along the y-axis. RTCjs gives an Axis ruler for watching parameters quickly at any moment.
Many other libraries for making charts and graphs exist. Here are additional ones to consider exploring:
- C3.js is a D3-based reusable chart library.
- Morris.js is a strong library that has a simple interface, making it easy to make charts that look nice. It relies on jQuery and the Raphaël JavaScript library.
- Smoothie Charts can be useful when dealing with streaming real-time data.
- Dimple is an object-oriented API for business analytics that uses D3.
- Charted, which Medium made, is a tool that makes pictures from data automatically. You only need to provide it with a link to where your data file is.
- GoJS is a library in JavaScript used for making interactive diagrams like flowcharts, organizational charts, design instruments and planning utilities.
- Chartkick.js is a tool that lets you make nice charts using just one line of JavaScript code.
Finally, here are some easy tools for easily making infographics.
- Easelly is a simple infographic builder that allows you to visualize any type of data.
- Infogram allows you to create interesting infographics and reports in minutes.
- Piktochart is a simple and easy application that allows you to represent numerous types of data.
Conclusion
When we consider making charts today, D3.js is often the first option that appears. As it is a project with open access, D3.js certainly introduces several strong functions not found in many other current libraries. Characteristics such as changeable properties, entering and leaving animations, strong transition effects, and the resemblance in syntax to jQuery rank it among top JavaScript libraries for creating charts. Charts with D3.js get displayed using HTML, SVG, and CSS.
D3.js is different from many JavaScript libraries because it does not come with ready-made charts. But you can see a collection of graphs made using D3.js to understand what it offers. As you can see, D3.js offers a wide range of chart types.
For those starting out, the learning process might be challenging. However, numerous tutorials and materials are available to help beginners.
How much is a great User Experience worth to you?
Browsee helps you understand your user's behaviour on your site. It's the next best thing to talking to them.

