Crazyegg vs Browsee
If conversion rate optimization (CRO) is something you are serious about, you need to test and measure, gather feedback, make changes in response to that feedback, and test again until your page starts converting. This can be aided by heatmap software like Crazy Egg and Browsee, but which is the best? We are going to look through one of Crazyegg free alternatives in this article and compare them with each other. Then you can decide for yourself which software is the best for you.
Crazyegg vs Browsee
Browsee
Browsee is a Crazyegg free alternative that uses session recordings, heatmaps, funnels, and feedback forms to help website users understand their pain points.
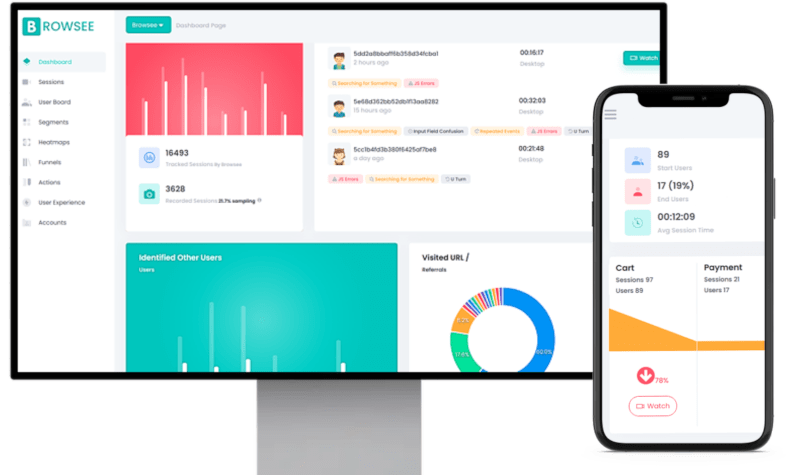
By providing you with deep-generated insights into your customer experience, Browsee assists you in lowering churn.
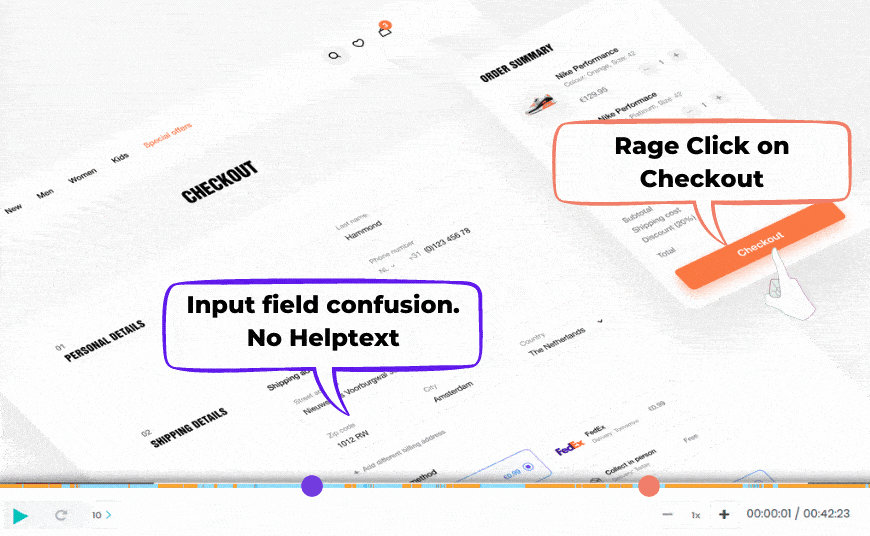
- View the session recordings with tags such as angry clicks, mistakes, unclear input fields, searching for something, etc. You gain knowledge from these sessions about how to enhance your customers' experiences.
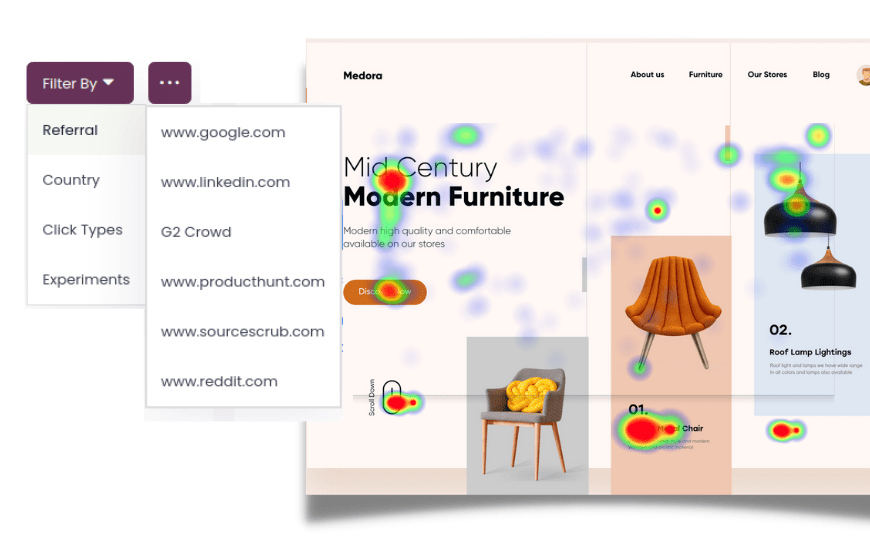
- Use click, scroll, and attention maps to analyze heatmaps to determine the level of page engagement. Segment the heatmaps based on the different types of traffic to tell whether traffic from ads or SEO is performing better on your pages. Learn how the behavior of the traffic that converts compares to the traffic that does not.
- Obtain segments and no-code funnels so you can create them without sending us an event.
- Feedback forms to gather reviews and NPS.
Features of Browsee
Some excellent tools allow you to view session replays, heatmaps, and funnels, making it a good Crazyegg free alternative, but choosing which session to watch to gain insights is the real challenge.
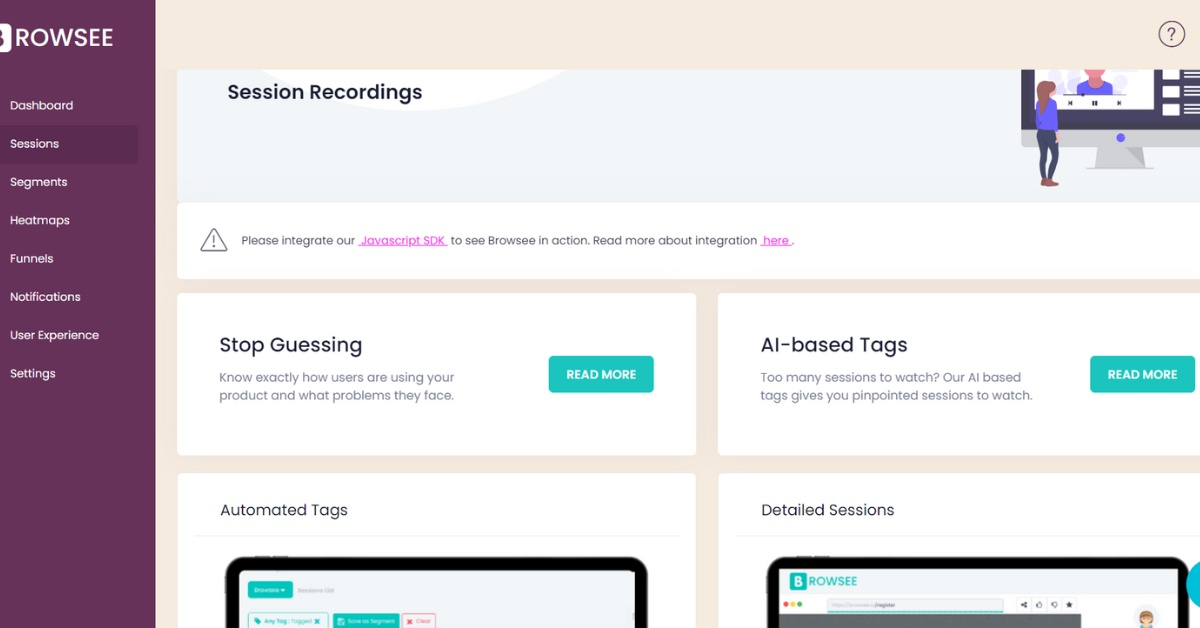
AI Tags Automatically on Session Replays
The ability to filter sessions using user actions is helpful, but it also eliminates the chance of unintentionally finding sessions that are worth watching. AI tags identify the most interesting sessions for you to watch. With Browsee, observing sessions requires 95% less work.
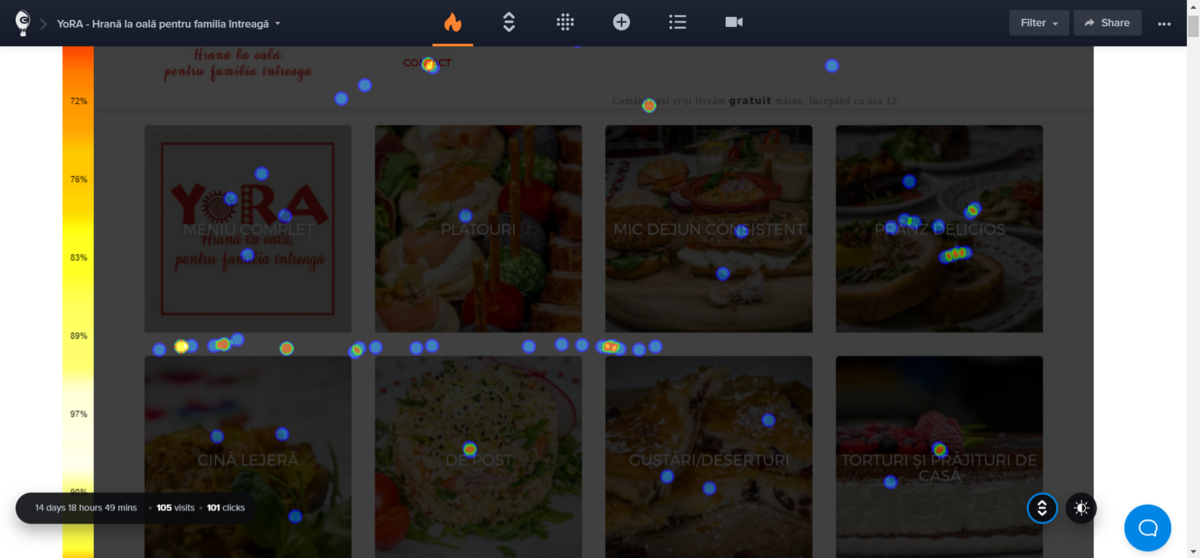
Always-on Heatmaps with time Comparison
You can alter your pages using Browsee’s always-on heatmaps and then compare the heatmaps side by side to better understand how the altered pages are performing.
Component Analytics
It is not simple for frameworks like React, Angular, and Vue to track components rather than a page. For instance, you can use Browsee’s component analytics to track the cumulative performance of a signup modal or a card that is used on multiple pages. Additionally, you can easily segment its performance for different audiences.
No Code Events
With retrospective data, you can easily track any button or element without adding a single event. Browsee respects user privacy and provides every option for session anonymization.
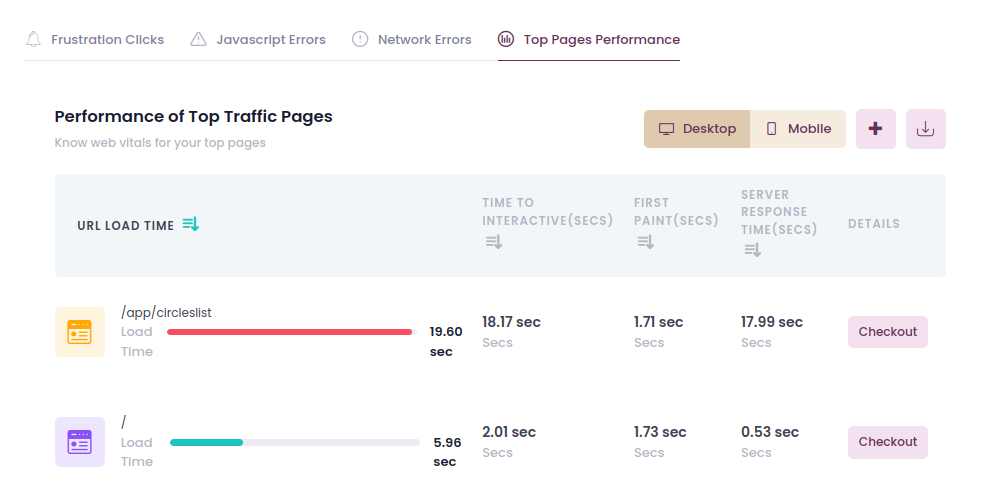
Page Efficiency
Browsee lets you track your key pages and their end-user performance. To keep you informed of the page's performance, we measure Chrome Core Vitals across end-user browsers and present a detailed analysis to you.
Browsee Pricing
- Starting price: $19.00 per month
- Plus: $49/month
- Pro: $103/month
- Executive: $239/month
- Free trial: Available
- Free version: Available
This pricing, while correct as of the writing of this blog, is subject
to change. Please see for the most up-to-date pricing.
Pros
- Excellent customer service.
- You can find the right things with the help of the funnel view and numerous filter options.
- Amazing software that increases conversation for your business. The software is so simple to incorporate into your website.
Cons
- Although not the most attractive, the UI serves its purpose.
Crazyegg
Crazy Egg technology allows click-tracking, hotspot identification, and seeing where visitors stop scrolling. By visually displaying users' clicks, heat mapping technology helps you understand what they want and do on your website. You can identify any changes to your website's design required by viewing the activity on page hotspots.
You can also see how many visitors are clicking and where they are clicking thanks to the overlays. And you can determine when users are no longer paying attention by watching how far down the page they scroll. With Crazy Egg, you can track visitors and traffic sources to particular behaviors, such as the page landing associated with a keyword or what Facebook traffic does on your site.
Crazy Egg is made up of four tools:
- Heatmap: A visual representation of where people clicked on your website. You can use it to see what is popular and what isn't.
- Confetti: Analyze the websites that people click on and the reasons why.
- Scroll map: This shows how far down users are scrolling so you can determine the point at which users abandon the page.
- Overlay: Get to know each component on your page better.
Features of Crazy Egg
With Crazy Egg, you can enhance your website without incurring exorbitant costs. It has an easy-to-use interface and is very simple to install. It enables you to instantly optimize your website based on the usage trends of your visitors.
Heat Maps
When you select the link to view the results for a particular snapshot, you will be directed to a page similar to the one below. The Heat map will appear by default.
The heatmap shows where your visitors are clicking on your site. The more light there is, the more populated the area is. The less popular the area is, the darker it is. The color of a particular area of your website will change as more people click on it on the heatmap.
Heat maps display "hot" and "cold" areas but do not display the number of clicks each link has received. You must open the Overlay report to see how many clicks were received.
Scroll Maps
You can see the patterns of scrolling on your website using scroll maps. Visitors spend more time on some parts of your website when they scroll down the page than on others.
The scroll map displays how frequently each section of the page was visible in a browser window. Dark areas were viewed less frequently while bright areas received more impressions.
Darker areas are viewed less frequently than the lightest (hottest) areas. If you have a landing page, keeping track of the areas where users spend more time will give you a lot of information about the successful and unsuccessful types of content. One of CrazyEgg's best features is the scroll maps.
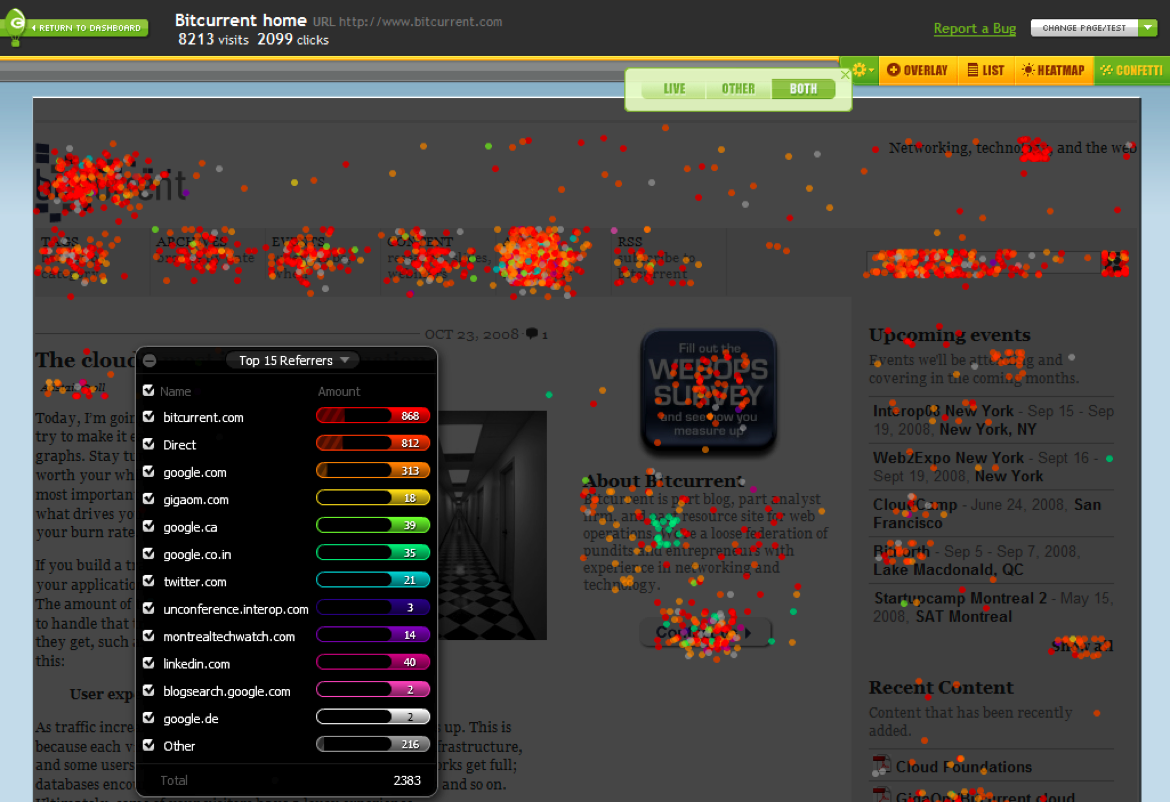
Confetti Maps
Confetti maps will display the number of clicks coming from various referral sources. The different colors used to identify each referral source allow you to compare the effectiveness of various traffic sources.
Here, you can see that the distribution of clicks from search engines differs from the pattern of clicks coming from direct traffic. To better understand the click patterns, you can also turn on and off particular referral sources.
Overlays
Heat maps will show you the volume of clicks in particular areas of your website, but they will not reveal how many people clicked on each link. Overlay maps will display the number of clicks received by each link.
Overlay reports are not unique to CrazyEgg. There are numerous other Crazyegg free alternatives, such as Browsee, that can display overlay reports.
Crazyegg Pricing
- Starting from: $24/month
- Standard: $49/month
- Plus: $99/month
- Pro: $249/month
- Enterprise: Contact Crazy Egg for pricing
- Free Version: Not available
- Free Trial: available
- Subscription: available
For new users, Crazy Egg offers a 30-day free trial after which the software is offered at 5 different price tiers, as detailed above.
Pros
- It creates heatmaps based on what users click on the website. It provides you with a graphical representation of the user's actions.
- It creates a scroll map by tracking how far users scroll on pages and when they become disinterested in the content.
- It generates overlays and Confetti to track the operation of a website.
- It captures a screenshot of the URL, gathers all of its clicks, and then displays the data as a heatmap on the image. This makes it simpler to comprehend.
Cons
- Even when traffic is distributed equally between the two-page variants, the snapshots occasionally record fewer visits than the other variant.
- There are not many heatmap visualizations in Crazy Egg.
- Once the maximum number has been reached, snapshots must be deleted. And if you take page views from mobile and desktop devices, the maximum is reached quickly.
Crazyegg vs Browsee: Conclusion
You can test each one to determine the comparisons of Crazyegg vs Browsee, Crazyegg vs Hotjar, Crazyegg vs Fullstory, and which one offers the best website and conversion rate optimization solutions. By literally observing what on your site visitors are interacting with, how often, and with what zeal, you can assess your goals to help you understand what they want and need and how they want it.
When you do, either Crazy Egg or Browsee can assist you in resolving user experience issues, optimizing landing pages and opt-in forms, and boosting conversions, sales, and loyalty while also improving opt-in form completion rates. If I had to pick one Crazyegg free alternative, I would say Browsee is where I would start. Browsee offers competitive pricing plans compared to Crazyegg pricing, which is suitable for most businesses, depending on the goal you are pursuing.
How much is a great User Experience worth to you?
Browsee helps you understand your user's behaviour on your site. It's the next best thing to talking to them.

