Cohorts And Cohorts Analysis For Products And Tools To Use For Them
When building an app, long-term achievement no longer means simply getting a user to download your app. It also means getting them to visit repeatedly. How do you measure that correctly? Using vanity metrics like download counts, daily active users (DAU), or monthly active users (MAU) just measures growth and retention superficially. To dig deeper into how users spend time on your app, you need to use cohort analysis.
What is a cohort analysis?
A cohort is a group of individuals who have something in common within a defined time span. Cohort analysis is the analysis of cohorts about huge data and commercial enterprise analytics. It’s a subset of behavioral analytics that measures consumer engagement over the years. A cohort analysis is a beneficial report to understand seasonality, client lifecycle, and the long-term health of your enterprise.
Tech and B2B companies that have long sales cycles and struggle to apprehend the effectiveness of their marketing campaigns might find cohort analysis a very effective tool to use. It’s also useful for other industries that depend on long-term engagement. By using cohort analysis to measure retention, you could see the share of customers that returned to your website over the years to complete transactions or convert.
What are the two types of cohort analysis?
Now that we have understood what cohort analysis is, let’s evaluate its different types.
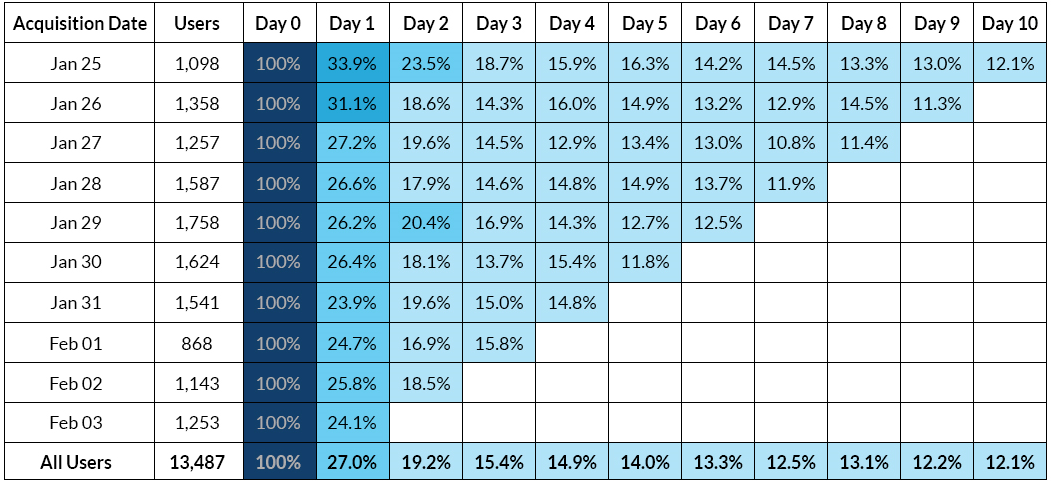
1. Acquisition Cohort Analysis
Acquisition cohort analysis is a generally used kind wherein marketers divide users into groups based totally on when they signed up for their product or began using it. It helps check and examine user conduct, measure the overall performance of various cohorts, and optimize customer retention techniques.
2. Behavioural Cohort Analysis
As the name shows, this kind of analysis groups users based totally on unique actions like their order value, buy frequency, feature adoption, or maybe how they interact with your campaign. Behavioral cohort analysis identifies user behavior that indicates higher client retention. In other words, it enables marketers to identify high-value cohorts and tailor their advertising efforts for these segments.
Why is cohort analysis important in digital marketing?
Here are some reasons why cohort analysis is essential for digital marketers:

To Understand User Behavior
We all can agree that every marketer needs insights into how customers behave over time. That is the only way to make digital advertising fruitful. Cohort analysis lets you do exactly that.
You can divide your whole user base into smaller groups or cohorts based totally on their shared features, like their time and date of acquisition. Alternatively, you may create cohorts based totally on how they interact with your product.
This makes it less complicated to study traits and discover the preferences of various user groups. As a result, you can create more focused strategies to target each user.
To Personalize UX
Personalization is the only method to boost customer loyalty closer to your product. In reality, around 70% of the entrepreneurs that use personalization see over 200% ROI on their advertising efforts. Cohort analysis enables you to personalize the user experience at scale effortlessly.
Cohort analysis offers insights into how distinct consumer companies have interacted with your brand messaging and campaigns through the years. Based on that, you can modify your messages and promotional offers to better resonate with specific target groups. It results in advanced user satisfaction, boosting engagement and conversions across cohorts.
To Improve Customer Retention
According to research, enhancing consumer retention by 5% can raise income by over 25%. That is why you need your clients to keep using your product, not just purchase it once. Or when you have an app, you want them to download it and use it regularly.
Using cohort analysis, you can measure the retention rates of different consumer cohorts. At the same time, you can identify the elements that lead to better retention and those that cause churn. This allows you to understand the wants and needs of different groups. As a result, you can easily take steps to improve customer retention, whether it is introducing new features, giving targeted offers, or improving your patron onboarding process.
To Measure Marketing Performance
The next reason why cohort analysis is vital is that it allows you to benchmark your advertising efforts. You can check the effect of your campaigns on conversion rate, retention, sales, and other KPIs for different segments of your consumer base.
You can experiment with exclusive advertising techniques and check their overall performance to pick the proper channels and mediums to target distinctive cohorts. It enables you to optimize your financial allocation and reduce the waste of advertising sources.
To Improve Your Product
Lastly, you may additionally use cohort analysis to enhance your product. For instance, if you have an app, cohort analysis presents the perfect opportunity to test it based on the usage patterns of different groups.
Besides the everyday remarks you acquire, you can create cohorts primarily based on feature adoption, product version, usage patterns, etc. This will help you become aware of and prioritize product improvements that align with your customer’s needs.
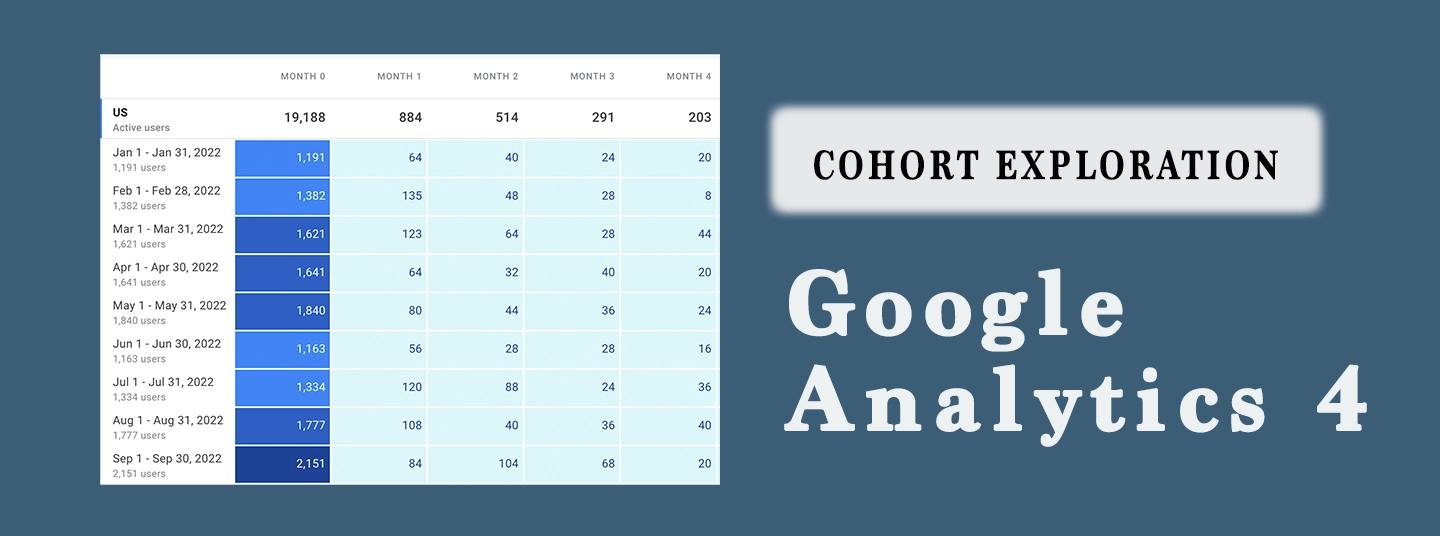
What is Cohort Analysis in GA4?
Google Analytics 4 offers the most convenient way to do cohort analysis. It has a built-in cohort exploration report template to create cohorts primarily based on predefined segments and dimensions for metrics like monitoring active customers, event count, purchase revenue, and more.
Creating Cohort Exploration in GA4
Let’s go through the steps of making a cohort exploration file in GA4.
Step 1: Log in to your GA4 property.
Step 2: Head over to the "Explore" segment within the navigation menu on the left side of your screen.
Step 3: Now, look for the Template Gallery option. Click it and choose Cohort Exploration.
Step 4: Now you will see the default cohort exploration, which indicates the sum of active users in weeks after the acquisition date.
Configuring Cohort Exploration in GA4
We can configure GA4 cohort exploration based on what advertising and marketing questions we need answers for. We can select from predefined segments or create custom segments based totally on customers, sessions, and events.
Similarly, we are able to pick dimensions to break down cohorts to view details like gender, platform, device, and more. Let's have a look at a few configuration options to be had inside GA4 cohort exploration.
Cohort Inclusion
As the name indicates, cohort inclusion lets you select the standards that users should meet to be part of your exploration. You can select from these criteria:
First touch (acquisition date): This is the first time a user has visited your website or app.
Any event: It is the first event that a user generates within the exploration duration.
Any transaction: It is the first transaction event that the user made in the selected duration.
Any conversion: The first conversion event the user generates inside the given date range.
Others: Other than the 4 predefined occasions, you could pick from a range of different events as inclusion standards, like ad click, app update, app uninstalls, first visit, and many others.
Return Criteria
The return criteria choice permits you to pick a returning circumstance that customers need to satisfy to be covered for your exploration. Some return standards to be had in GA4 cohort exploration are:
Any occasion: This criterion calls for the user to have at least one event within the decided-upon date range.
Any transaction: This return condition calls for the user to have at least one transaction within the agreed-upon date range.
Any conversion: The consumer should have at least one conversion in the exploration date range.
Others: Similar to the inclusion criteria, you may select a few additional activities apart from the predefined ones that customers generate within the exploration period.
Cohort Granularity
Cohort granularity is the process of making a decision about the initial and return cohort time frame for your exploration. You have three options:
Daily: Selecting each day's granularity suggests statistics from midnight to midnight of the next day according to your property's time zone.
Weekly: Includes cohort information from Monday to Sunday.
Monthly: shows facts from the beginning of the month until the end.
Cohort Calculation
This choice permits you to pick out the approach for calculating metrics for the required time frame. You can choose from these three calculation techniques:
Standard: This approach consists of all customers who meet the return criteria for the chosen time frame in each cell of your exploration, regardless of their activity in other periods.
Rolling: In this calculation, every cell consists of users who meet the return standards for the set period as well as previous durations.
Cumulative: The cumulative calculation approach encompasses all users in each cell who meet the return standards at any period.
Breakdown
This option lets you divide your cohorts into sub-groups. You can split your cohorts by using dimensions like gender, platform, device, etc.
Values
The value option is where you pick the metric you want to track for your cohorts. You get four predefined metrics: active users, event count, transactions, and purchase revenue. You can also pick events aside from the predefined events.
How to Perform Cohort Analysis Using Google Analytics
Google Analytics is any marketer’s go-to tool for mining information on website visitors, key metrics, and conversions. Additionally, it has a neat cohort analysis presentation (in beta mode right now) that you may use even if you aren't a strong user of GA.
To get started with a cohort analysis using Google Analytics, head to AUDIENCE → Cohort Analysis.
At the top of the report, you will locate several cohort settings that may be tweaked to generate the cohort report. The settings that you could tweak consist of cohort type, cohort size, metric, and date range.
Here’s what each of those terms stands for:
Cohort Size: Cohort length refers back to the term for which you want the cohort analysis to be executed. This might be a day, every week, or a month.
Cohort Type: The group of customers or information you need to research. Currently, Google Analytics gives only one cohort kind: acquisition date, which is the first time the user interacts with your asset.
Date Range: The time period for which you want to do the cohort analysis is within the date range. Google Analytics gives the date degrees for a month, “last 2 months”, and “last 3 months”.
Metric: The cohort analysis record may be centered on precise per-user metrics. The default metric set in Google Analytics is consumer retention. Other metrics that you could select consist of:
- Goal completions per user
- Transactions per user
- Revenue per user
- The session duration per user
- Sessions per user
- Pageviews per user
Conclusion
Cohort analyses are very effective and might give you a far deeper understanding of your users, seasonality, and long-term enterprise health. Google Analytics affords a very smooth way to have a look at overall cohort performance, but it can be problematic while diving deeper into a cohort. It’s crucial to always know what cohort you’re looking at by considering the size of the cohort and what the suitable comparison could be.
How much is a great User Experience worth to you?
Browsee helps you understand your user's behaviour on your site. It's the next best thing to talking to them.

