10 Magic Metrics for Product/Market Fit - Conversions & Customer Retention
When you have a great market with a great product that fits the customer's need, something magical happens and you would know it. Just like your first love!
A few companies who have seen rapid and magical growth because the market responded so well to the product are Reddit, Facebook, Quora, etc.
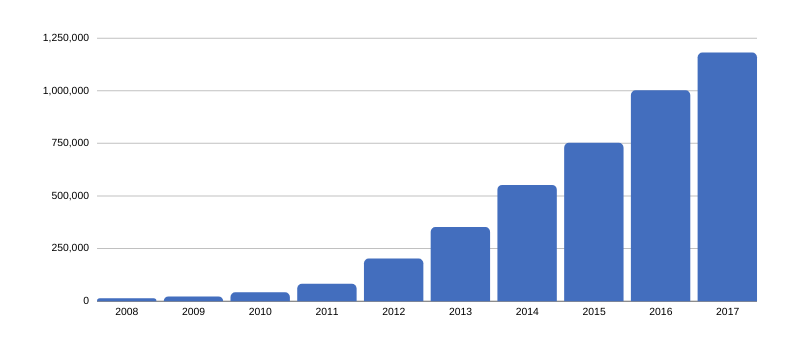
Here is a graph showing how the number of subreddit's skyrocketed over the years despite being in controversies for many times. It would be hard to find any topic that is not discussed on Reddit.
What is Product/Market Fit?
Product/market fit means being in a good market with a product that can satisfy that market. - Marc Andreessen
Let's try to understand what does it mean to have a product/market fit. We may have several definitions in our minds for a product/market fit but the most simple 4-word definition is -
Make Something People Want. - Paul Graham
When you are building something that your users genuinely like, you become unstoppable. However, it is hard to succeed even with a great market and great team, if you are not listening or understanding the customer needs.
If you address a market that really wants your product — if the dogs are eating the dog food — then you can screw up almost everything in the company and you will succeed. Conversely, if you’re really good at execution but the dogs don’t want to eat the dog food, you have no chance of winning. - Andy Rachleff
Success is all about having a great market, identifying the market's needs, and a well executed product to satisfy the customers.
Although, no one said that it is easy. It would probably take several iterations on your product before you can achieve that.
How to identify a great Market for my startup?
A great market usually is -
- A relatively new market which is growing rapidly like drones, digital education or streaming services or OTT in current times
- It does not have a big barrier to entry like legal or regulatory issues - although even law changes can create some great new markets.
- Does not yet have a strong brand, like you would not prefer to compete against Google
- Last but most importantly, can you as a founder empathize with the market or the users? Do you carry a strong motivation to solve the need?
How to know if your product has achieved a product/market fit?
It is not hard to tell when your product does not have a product/market fit at all. Some of the common early signs are -
- Getting a new user is a struggle. No matter, how hard you try to sell, the sales don't happen.
- You users are neither talking to you nor talking about you on social platforms (word of mouth marketing).
- The usage of the product is really low which means users are not actively coming on the product by themselves.
- You are not getting any PRs by default. In fact, you have to try hard and reach out to your contacts to get into one.
- Your sales cycles are long and tiring with most of the deals not happening in the end.
- Your customer support is sitting and talking to each other instead of the real users.
If all of these points hold true, believe me, you have a problem. However, from our experience, the reality is usually much more subtle. It is not black and white, it can be any shade of grey.
This makes it harder to determine whether you have achieved a product/market fit or not. Even with all your product's failings, you will find a couple of users using you or saying a few positive words on the social mediums. Even when you have a killer product you will find many users, who are like - Meh!
You will only be able to answer the product/market fit by objectively looking at the problem. Andrew Chen, partner at Andreessen Horowitz has simplified the solution to this problem in one of his posts and we will elaborate on the points from his Tweet in this section.
Top 10 metrics indicating that you have a product/market fit
- Your product is sticky which means your Cohort Retention Curve is flattening
- Your Power User Curve is smiling which means your users are engaged and they keep coming back on the product
- You virality factor is more than 1.5 where your user becomes a source to touch your non-users
- The ratio of Daily Active Users to Monthly Active Users > 0.5 which means your users have formed a habit of using your product almost on a daily basis
- The daily user frequency at Day1, Day7 and Day30 > 60%, 30% and 15% respectively
- The percentage of actives/registered > 25%
- You have a great organic strategy to acquire new users which almost tends towards zero. This mean you drive > 60% of your traffic organically without any ads or paid promotions
- For subscription-based businesses like SaaS, you have > 65% paid user retention on an annual basis
- You have > 4X Annual Growth Rate (AGR)
- Your revenue or activity expands on a per user basis over time which means your user is deeply engaged or has a habit to use your product
According to Andrew, if any of these holds true, you have some level of product/market fit and you can iterate from there. If multiple hold true, Bam! You have a product/market fit already!
Let us try to unfold the meaning, importance, and tools to measure these magic metrics.
#1 - Cohort Retention Curve
A cohort is a group of users sharing a common characteristic like users who signed up on the same day or users who have placed at least one order. A Cohort Retention Curve helps you in visualizing your retention for a cohort over time. Tracking retention would help you in determining whether you have achieved a product/market fit or not.
The best thing to measure the growth rate of is revenue. The next best, for start-ups that aren’t charging initially, is active users. That’s a reasonable proxy for revenue growth because whenever the start-up does start trying to make money, their revenues will probably be a constant multiple of active users. - Paul Graham
Based on Andrew's point, you have achieved some level of product/market fit if your Cohort Retention Curve is flattening. This indicates a set of users who have used your product are hooked now and keep coming back to use your product.
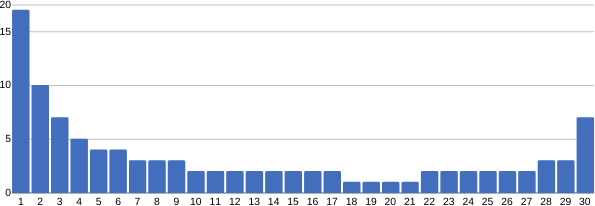
How your Cohort Retention Curve should look?
Though the flattening of Retention Curve is a good metric, yet the measure of fit depends on the level at which it flattens. The higher the level indicated the better your product/market fit.
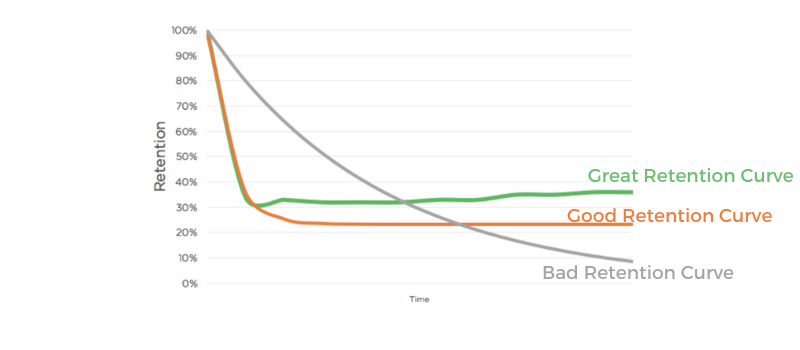
In the figure,
- Green curve represents great retention as the curve flattening level is higher as well as it is going up again making the smiling curve which means more users are coming back and are not yet churned.
- Orange curve represents good retention as the curve is flattening somewhat in the middle. It means you have achieved a 20-25% user retention.
- Grey curve is really bad as it says your users are churning with each day and they are not coming back to use your product again. This indicates either your value proposition is not convincing or the experience made them leave your product.
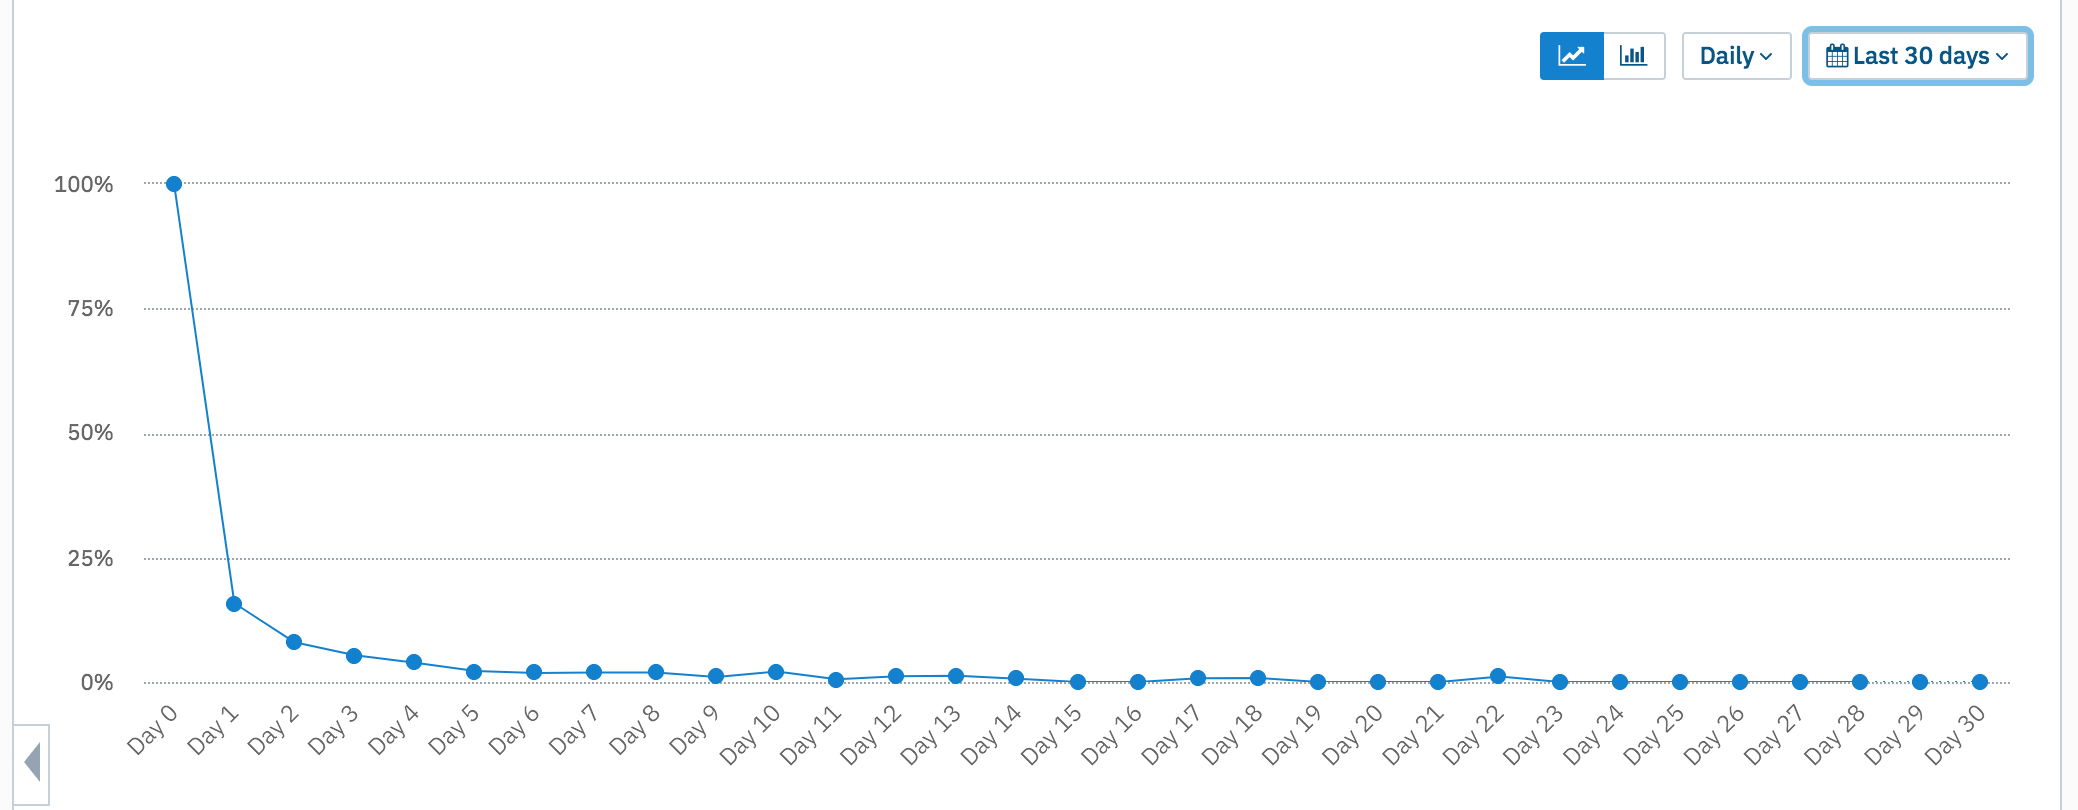
Just by a glance at your Cohort Retention Curve, you could say whether your churn is good, bad, or ugly. For example, say you are building a gaming app and you see 10% of users are dropping everyday and not coming back even in a long time and you immediately know that you have a churn problem.
A long time ago, we built a game named "Quiz of the Day". We got some good reviews and ratings on the app store but the retention curve was like Meh! An eye-opening proof that we are far away from achieving the product/market fit and our users are not hooked!
Do you know what would give you an awesome Cohort Retention Curve? Any user who comes or signs up for your product keeps on using your product forever.
In absence of that, a smiling curve is considered pretty good as Evernote's Retention Curve -
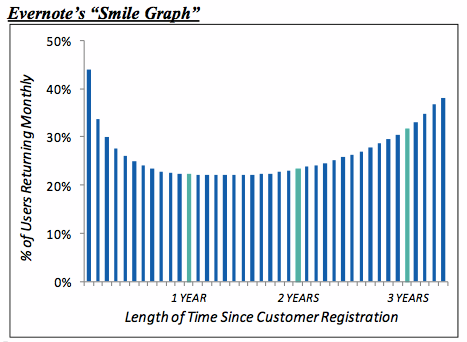
How come the curve smiles?
You achieve a smiling curve when even churned users come back due to the great developments in the product driving them back to use it or due to the extensive growth where someone else pitches for your product.
Tools to Measure Cohort Retention Curve
- Amplitude
- Mixpanel
- You can create your own in Excel as well if you get a data pipeline
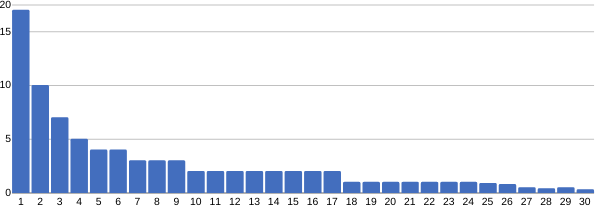
#2 - Power User Curve
Andrew considers Power User Curve as another important metric while making an investment. While it is important to keep a track of Daily Active Users (DAU) and Monthly Active Users (MAU), sometimes they do not represent the actual engagement. Sometimes, the core action is happening deep in the product and you want to judge your engagement on the basis of those core factors.
A great product/market fit will give you a smiling Power User Curve.
A smiling curve (a curve that goes down and comes up again) for power users depicts that your product is able to retain it's power users. Even if things look bad in the middle of the graph, it will grow up again eventually bringing a smile in the graph as well as on your face.
The advantage of power user curve is that you are not tracking all your users. It is a set of users who are already engaged with the product and you want to understand their retention over time. You have a problem if your power user curve looks like this
However, not every company needs a smiling power user curve especially if your business model is not based on users actively coming back on your website or app.
#3 - Virality or K-factor
It is the dream of every marketer or actor to create a viral internet sensation with their content, video, etc. The virality helps you in getting new customers without getting in touch with them. No new effort is required from the business side for acquiring new users and is one of the best kind of marketing flywheel (where users feed growth).
Virality works as your marketing flywheel where your existing users will bring new users and then those new users will bring another set of users and this will go on and on and on!
Viral marketing could be
- Word of mouth marketing where your users will become your promoter as well and promote your product amongst their friends or on social media platforms
- Referral marketing without bonus where you prompt your existing users to get their friends or family on your product
- For SaaS tools, an embedded link on user's websites prompting other users to use their product like "Landing Page powered by XYZ" or a link in user's privacy policy or a badge on user's website (that is what Mixpanel used as their initial marketing strategy) [Rare]
How do I measure the Virality factor?
For computing an approximate virality factor -
- Take your current number of users. Let's say current users = 2000
- Multiply it with the average number of invites sent out by your existing users. Let's say sent invite per user (on an average) = 3
- Multiply your existing user with the avg number of sent invites. In our case, 2000*3 = 6000
- Identify how many people have taken an action (like signed up or ordered) within a definite period of time. Let' say people who took action = 12%
- This would mean your updated user count is 2000 + 0.12*2000 = 2240
- Virality or K factor = (Total Users After Invites/Total User Before Invites) = 2240/2000 = 1.12
Now for word of mouth marketing this number is hard to compute however if you are prompting your users to invite others, make sure you place a proper source and medium in the invite URLs which makes it easier to compute the virality factor.
What should be my Virality factor?
The higher the number, the better the virality and it gives you an affirmation that your users love your product.
- If your virality factor = 1, that is of no good as it would mean you are failing and users are not liking your product.
- Any virality factor > 1 gives you a few new user over time from the current set of users.
- When your virality factor > 1.5 that means your users becomes your promoters and will give you a chain growth. Extremely rare.
#4 - Ratio of Daily Active Users to Monthly Active Users
Another key metric for product stickiness is the ratio of daily to monthly active users. It gives you an idea of how often people engage with your product.
Daily Active Users (DAU) - Number of unique users who engage with your product in a day
Monthly Active User (MAU) - Number of unique users who engage with your product in a month
Who should be counted as an active user?
The definition of active users can be simple like the number of unique viewers or it can be counted as a unique user performing a certain action on your product or your business. It depends on whom you wish to be counted as an engaged or active user.
- SaaS - Active users can be computed as the number of active users doing a core activity, coming to the dashboard or inviting a team member
- Gaming - Active users can be computed as opening the app, playing the game or inviting a friend
- Publishers - Active users can be counted as viewing a page, log in or reading a story
Once you know the definition of your active users which aligns with your business value, you can compute the number of DAU and MAU as the number of active users in 24 hours and in 30 days respectively.
What should a good DAU/MAU?
Although the goodness of this ratio varies with your industry and business type, however, the number below is a general benchmark -
- DAU/MAU < 0.2 is considered to be bad
- 0.2 < DAU/MAU < 0.5 is considers to be good
- DAU/MAU > 0.5 is considered to be excellent, also implying you have made a product that is sticky and users are already in a habit to use it. (Facebook has DAU/MAU > 0.5)
#5 - Daily User Frequency
Another metric is to count your daily user frequency for Day1, Day7, and Day15. It is calculated as the number of active users engaging with your product on 1st, 7th, and 15th day after signup or installation.
It could also be easily determined from the customer retention curve that we discussed earlier or it can be computed from the cohort analysis.
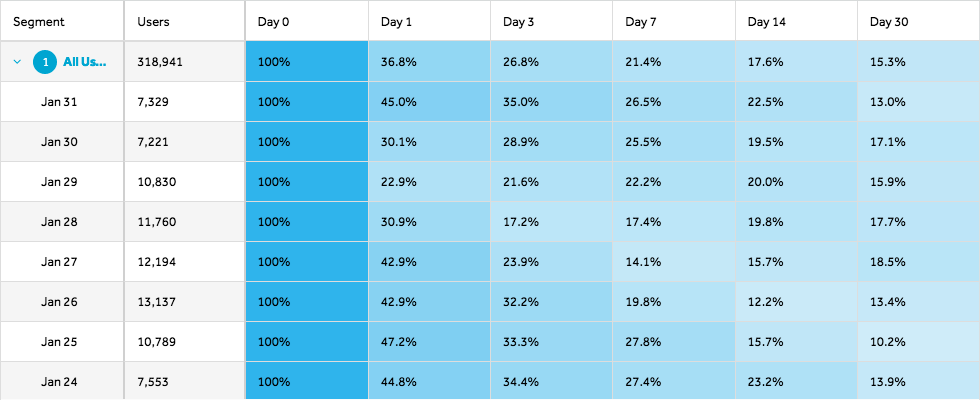
Good D1, D7 and D30 Frequency
According to Andrew, it is great to have a user frequency for D1, D7 and D15 > 60%, 30% and 15% .
It also gives you a starting point to focus on how to improve retention for users falling in different categories. If your week 1 retention is very poor but sees a significant improvement afterwards, it means you need to improve you on-boarding strategy.
#6 - Percentage of Actives Vs Registered
Another good metric to keep under check is the percentage of users who users your product. This is not related to DAU or MAU which might be not so useful metric for some businesses.
So, a good metric could be the percentage of actives vs registered over a time period. According to Andrew, if your actives/registered > 25%, then you already have a good product that is liked by your users.
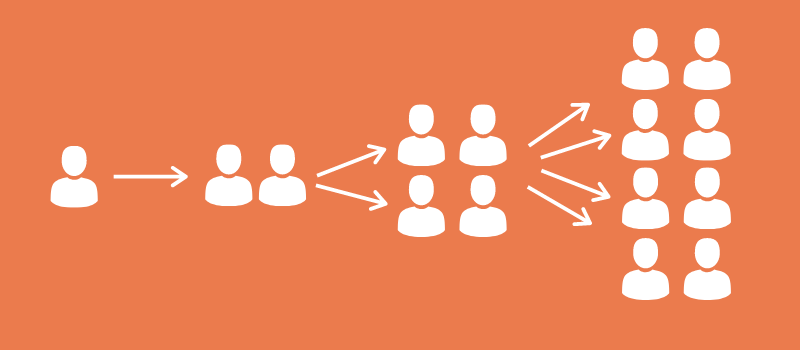
#7 - Good Organic Traffic
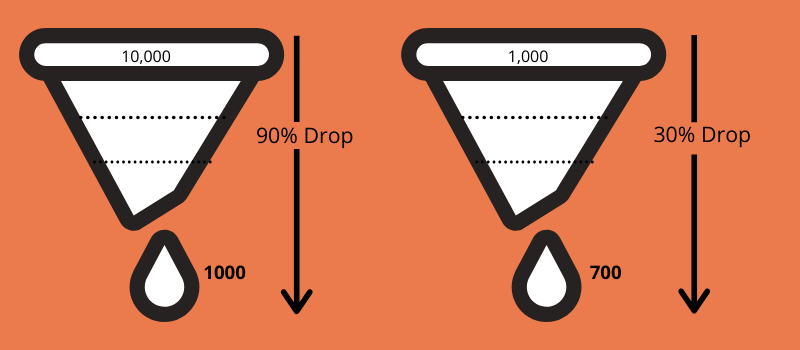
We all understand the concept of a funnel. No matter, how good your product is, you are going to face a drop at each step of the funnel. To have 10X number of users at the end of the funnel -
- Either, you can increase the top of the funnel by 10X
- Or, you can have a 10X better conversion rate
As shown below, you can see two funnels, one with really high traffic with 90% visitors dropping sees the higher number of conversions as another funnel with only 30% visitors dropping. Thus, with high FREE traffic, even a mediocre product can perform better in terms of revenue than a great product with low traffic!
Organic traffic refers to the traffic which lands on your website via "Search" results of Google, Bing, Yahoo, Baidu, etc. So, this is unpaid traffic which is not even referred to by any other website.
A big chunk of any company's revenue goes back to marketing. This means businesses spend a significant chunk of money to bring more traffic on your website via Ads, Referrals, etc.
A company spends 11.2% of it's revenue on marketing on an average. - Gartner Report
If you have figured out a way where you can bring more and more traffic without spending a dime, you have a business model!
If your business has > 60% traffic coming from organic channels, you stand a chance to build a sustainable business.
How to get organic traffic -
- Have a way to add User Generated Content (UGC) like forums or blog comments. Look at Quora, StackOverflow, or Reddit where UGC brings them on the first page in Google Searches. Nothing beats UGC as you get traffic without any writing efforts from you or your team.
- Consistently write blogs and optimize for keywords. It is always easier to get more traffic on new and trending topics, so keep an eye if you can contribute to those topics. Look at Neil Patel who is a brand and gets millions of visitors on his blogs. He has a product UberSuggest which quickly gets attention from a lot of visitors and has a big competitive advantage over similar products like AHref, SEMRush, etc.
- You can also try to get guest posts or posts from influencers as it is easier to get traffic.
- Another good way is to create a podcast or a video blog as they are comparatively new and search engines are promoting video content over written content.
Organic traffic is hard to earn but once you have an organic traffic pipeline, you do not need to spend much on the marketing and you have created a sustainable way to bring traffic on your product.
Another good thing about organic traffic is the compounding effect. You will be able to reap the value of content marketing over the years. Your blogs have an additive effect just like your Fixed Deposits which will keep on growing over the years.
#8 - Annual Retention for Subscription-Based Businesses
Retention Rate is one of the key growth metrics for subscription-based businesses. A high retention rate automatically implies that your product has a low churn rate.
When it comes to growth, businesses usually focus too much energy on acquiring new users. However, a common mistake is to ignore the retention numbers. Now, just by simple logic,
Revenue Growth Rate = 0 if, for every new paid customer, you lost one old paid customer
In general, churn is bad for any product as it affects many key metrics -
- Monthly Recurring Revenue (MRR)
- Customer Life Time Value (LTV)
- Customer Acquisition Cost (CAC)
- Customer Satisfaction Score
For subscription-based business, you have a sustainable business model if you have > 65% paid user retention on an annual basis
#9 - Growth Rate
If there’s one number every founder should always know, it’s the company’s growth rate. That’s the measure of a start-up. If you don’t know that number, you don’t even know if you’re doing well or badly. - Paul Graham
One of the main metrics for accessing the potential of a startup is the Annual Growth Rate or AGR. It is a true indicator of the profit and sustainability of a business in the long term.
According to Andrew, if you have > 4X Annual Growth Rate (AGR) then you have a good growth rate. If your year 1 revenue is 10k then this implies
- Year 2 revenue = 40k
- Year 3 revenue = 160k
- Year 4 revenue = 640k
and if you keep growing at the same rate for 10 years ...
- Year 10 revenue = 2.6 billion
#10 - Revenue/Activity per User Basis
If your revenue or engagement metric increases with every user, the compounding effect will increase it!
So, let us say with every user there is a 10% increase in revenue or activity which implies -
- At 1k users, let's say you have 10k revenue
- At 10k users, you will have 10k + .1 * 9000 = 10.9 k revenue
- At 100k users, you will have 10k + .1 * 99000 = 19.9k revenue
If your revenue or activity expands on a per user basis over time it means your user is deeply engaged or has a habit to use your product.
If you have liked the article and wish to optimize your website for UX and Engagement, I would recommend installing Browsee on your website.
If you need any help, you can directly reach to us at contact@heroteck.com.
Ciao!
How much is a great User Experience worth to you?
Browsee helps you understand your user's behaviour on your site. It's the next best thing to talking to them.

