Session Replay Tools vs Analytics Tools: Understanding the Differences and Unveiling the Visual vs Aggregated Paradigm
If you are here, you probably need to understanding user behaviour and optimising their experience. To achieve this, you may have deployed various tools and technologies, including session replay tools like Browsee and analytics tools like Mixpanel and Amplitude. While these tools aim to improve user experiences, they approach data collection, analysis, and visualisation in distinct ways. This article will explore the differences between session replay and analytics tools, focusing on their visual versus aggregated aspects.
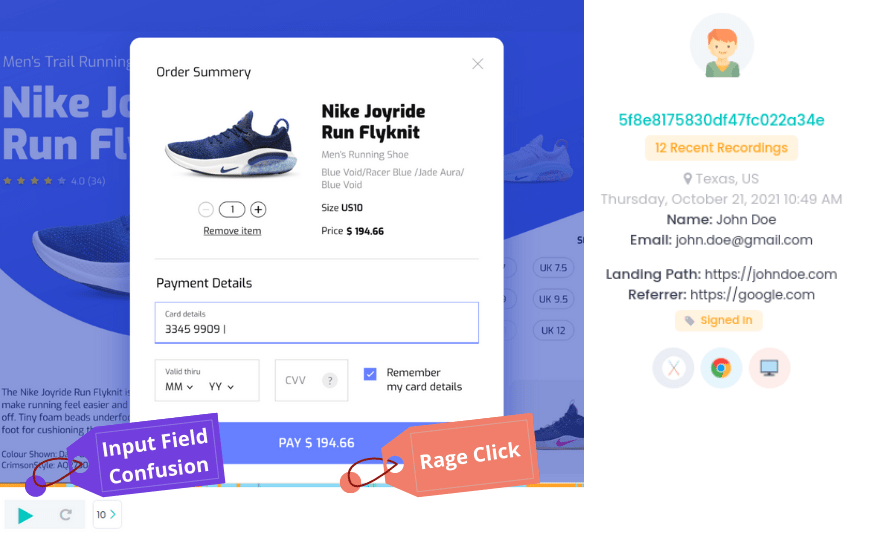
Visualising User Behavior with Session Replay Tools
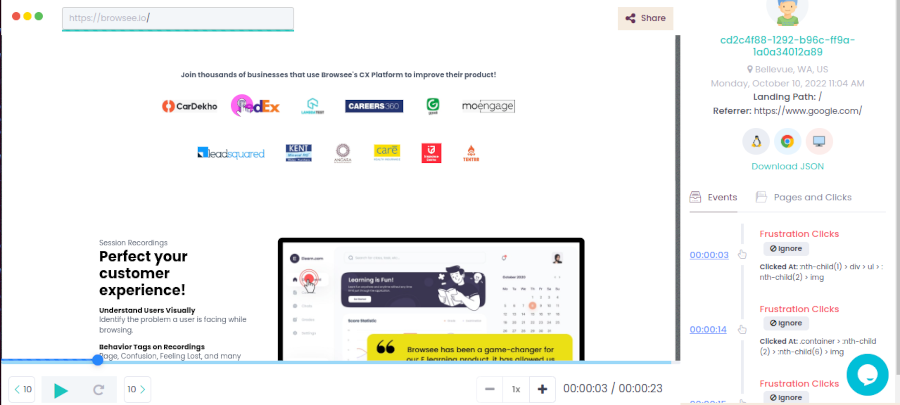
- Session replay tools provide a unique and captivating approach to understanding user behaviour.
- Rather than relying solely on aggregated data, these tools capture and visualise individual user sessions, offering a comprehensive and granular view of user interactions.
- Usually they automatically record and storing all user events and show them as and when they happen(ed) in the session.
Many session replay tools also create heatmaps.
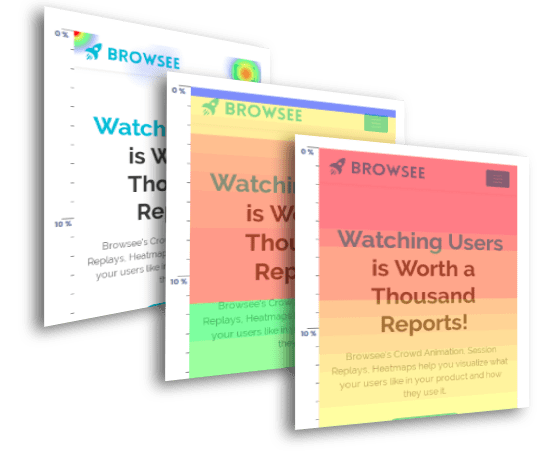
- Heatmaps visualise user engagement by highlighting the most interacted areas of a web page, allowing businesses to identify hotspots, user preferences, and potential areas for improvement.
- This visual representation of user behaviour helps identify pain points, uncover usability issues, and make data-driven optimisations.
Moreover, session replay tools often offer advanced search capabilities, enabling businesses to filter and segment user sessions based on specific criteria.
By analysing the recorded sessions, companies can gain insights into how users interact with particular features or elements, helping them uncover hidden patterns or understand the effectiveness of design changes. This visual analysis can significantly enhance the understanding of user behaviour, leading to targeted improvements in user experiences.
The Aggregated Insights of Analytics Tools
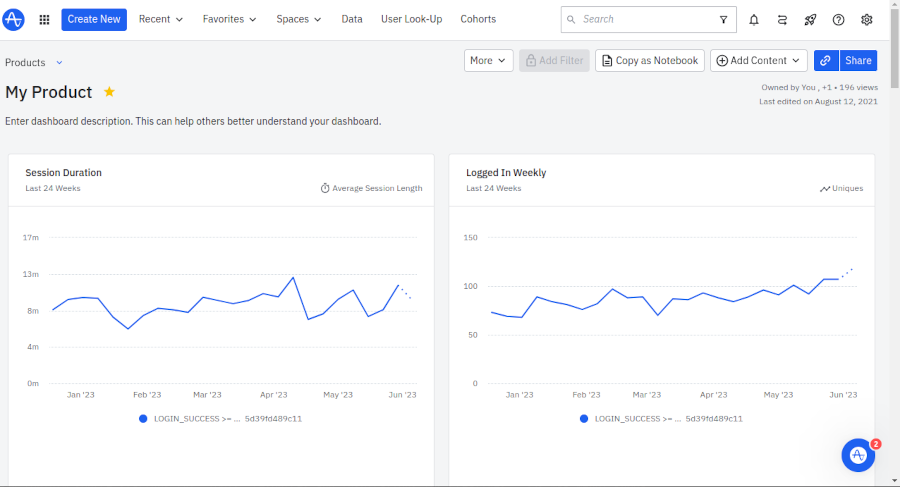
While session replay tools like Browsee excel in providing visual representations of user behaviour, analytics tools like Mixpanel and Amplitude adopt a more aggregated approach to data analysis.
These tools focus on collecting and processing large volumes of data from various sources, enabling businesses to derive actionable insights and make informed decisions at a macro level.
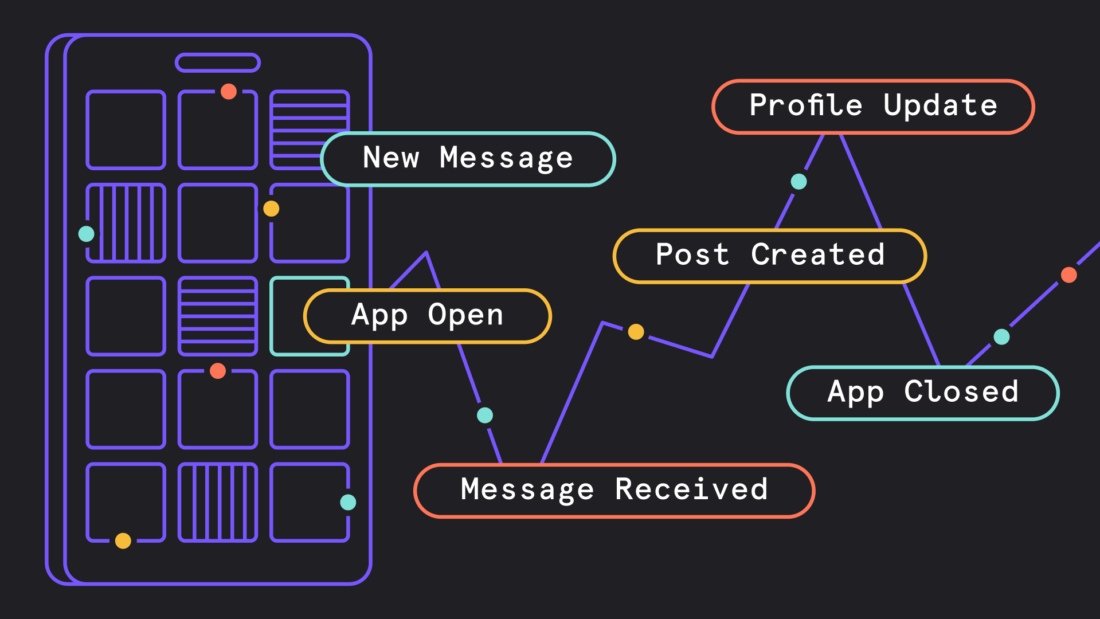
- Analytics tools require integration with each event, allowing businesses to define and track specific events, actions, or goals.
- This enables the measurement of key performance indicators (KPIs), such as click-through rates, conversion rates, and user retention, providing businesses with an overview of their product's overall performance.
- By aggregating data from numerous user interactions, analytics tools give a bird's-eye view of user behaviour and identify trends and patterns that might not be apparent at an individual session-level.
- Unlike session replay tools, analytics tools can also capture and analyse server-side events. For example, Amplitude can track events like the number of emails sent or API calls made. This capability allows businesses to gain insights into backend processes and performance, complementing the frontend-focused features of session replay tools.
By analysing both frontend and backend data, companies can gain a holistic understanding of their product's performance and identify opportunities for improvement.
Integration and Ease of Use
When integrating these tools into your existing tech stack, analytics tools typically require manual event-tracking implementation. This process involves developers adding tracking codes or configuring event triggers, ensuring each relevant action is recorded accurately.
mixpanel.track('USER_SIGNUP');
.
.
.
mixpanel.track('PURCHASE_PRODUCT', {product_id: id});
On the other hand, session replay tools typically just involve installing a snippet and the all the client side events are automatically captured going forward.
window._browsee = window._browsee || function () {
(_browsee.q = _browsee.q || []).push(arguments)
};
_browsee('init', '...');
This ease of use and automation make session replay tools more accessible to non-technical stakeholders, such as UX designers or product managers, who can directly engage with user sessions and analyse behaviour without relying on developers for implementation.
When considering the integration and implementation of session replay tools and analytics tools, businesses should also take into account the following considerations:
Technical Implementation
Analytics tools often require manual event tracking implementation, involving developers adding tracking codes or configuring event triggers. This process ensures that the relevant user actions are recorded accurately. On the other hand, session replay tools automate event capture, eliminating the need for explicit event-tracking implementation. This ease of use makes session replay tools more accessible to non-technical stakeholders, who can directly engage with user sessions and analyse behaviour.
Data Privacy and Compliance
Businesses must ensure that their tools comply with relevant data privacy regulations, such as the General Data Protection Regulation (GDPR) or the California Consumer Privacy Act (CCPA). Understanding the data collection practices of both session replay and analytics tools and the options available to honour user privacy preferences, such as anonymisation or opt-out mechanisms, is essential.
Integration with Existing Tech Stack
To maximise the benefits of session replay and analytics tools, businesses should assess their compatibility with their existing tech stack. Integration capabilities, APIs,
and data export functionalities should be considered to ensure seamless data flow and interoperability between different tools and systems.
The Benefits of Visual Analysis with Session Replay Tools
Session replay tools offer a range of benefits through their visual analysis
capabilities, providing businesses with invaluable insights into user behaviour.
Let's explore some of the key advantages in more detail:
- Uncovering Usability Issues:
Session replays allow businesses to witness user interactions in real-time,
revealing usability issues or friction points within their digital products or services. By watching how users navigate through a website or application, businesses can identify areas where users may struggle or encounter confusion. This information enables them to optimise the user interface, streamline user flows, and enhance overall usability. - Identifying User Engagement Patterns
Heatmaps generated by session replay tools provide a clear visualisation of user engagement. By analysing heatmaps, businesses can determine which elements of their web pages or app screens receive the most attention and interaction. This information helps prioritise design and content elements, ensuring critical details or calls to action are strategically placed for maximum impact. - Validating Design Changes
Session replay tools can act as a validation mechanism when implementing design changes or new features. Businesses can assess the effectiveness of their design decisions by comparing session replays before and after the changes. They can observe how users respond to the alterations and determine if the intended improvements are achieved. This iterative process allows for continuous optimisation and refinement of the user experience. - Enhancing Conversion Rates
Session replay tools can play a vital role in optimising conversion rates. Businesses can identify patterns or bottlenecks that impact conversion rates by analysing user behaviour leading to conversions or drop-offs. This information empowers businesses to make data-driven decisions to streamline user flows, reduce friction, and improve conversion funnels.
The Power of Data Aggregation with Analytics Tools
Analytics tools like Mixpanel and Amplitude offer powerful data aggregation capabilities, enabling businesses to gain insights at a macro level. Here are some notable advantages of using analytics tools.
- Identifying User Segments Analytics tools allow businesses to segment
their user base based on various criteria such as demographics,
behaviour, or geographic location. Companies can tailor their marketing
strategies by understanding different user segments, personalising user
experiences, and optimising conversion funnels for specific target
audiences. This targeted approach helps maximise engagement and
improve overall user satisfaction. - Tracking Key Performance Indicators (KPIs): Analytics tools provide a
framework for defining and monitoring key performance indicators
relevant to a business's goals. These KPIs include click-through rates,
conversion rates, average session duration, and customer lifetime value.
By monitoring and analysing these metrics over time, businesses can
assess their marketing efforts' impact, identify improvement areas, and
set success benchmarks. - A/B Testing and Experimentation: Analytics tools often include built-in
A/B testing capabilities, allowing businesses to test different variations
of their digital experiences and measure their impact on user behaviour.
By running controlled experiments, businesses can make data-driven
decisions on which design, content, or feature variations drive better
outcomes. This iterative approach helps optimise user experiences and
achieve business objectives. - Cross-Platform Insights: Analytics tools enable businesses to collect and
analyse data from multiple platforms or devices. This capability is
particularly valuable in today's multi-channel landscape, where users
engage with digital products and services through various touchpoints.
By consolidating data from different platforms, businesses can gain a
holistic view of user behaviour, track cross-channel attribution, and
optimise the user journey across other devices.
Conclusion
In optimising user experience, session replay tools like Browsee and analytics play distinct yet complementary roles.
- Session replay tools excel in providing captivating visual representations of individual user sessions, allowing businesses to analyse user behaviour at a granular level.
- Heatmaps and session replays empower businesses to uncover usability issues, identify user preferences, and make data-driven improvements.
- On the other hand, analytics tools like Mixpanel and Amplitude offer aggregated insights, enabling businesses to understand macro trends and patterns across their user base.
- By integrating both tools into their workflow, businesses can comprehensively understand user behaviour and make informed decisions to enhance their products and services.
Remember, while heatmaps and session replays provide a visual and immersive experience, analytics tools offer aggregated insights to drive strategic decision-making. By leveraging the strengths of both tools, businesses can unlock valuable insights and create exceptional user experiences that resonate with their target audience.
How much is a great User Experience worth to you?
Browsee helps you understand your user's behaviour on your site. It's the next best thing to talking to them.

