Open Source Analytics Dashboard Building Tools
Every Product Needs A Dashboard
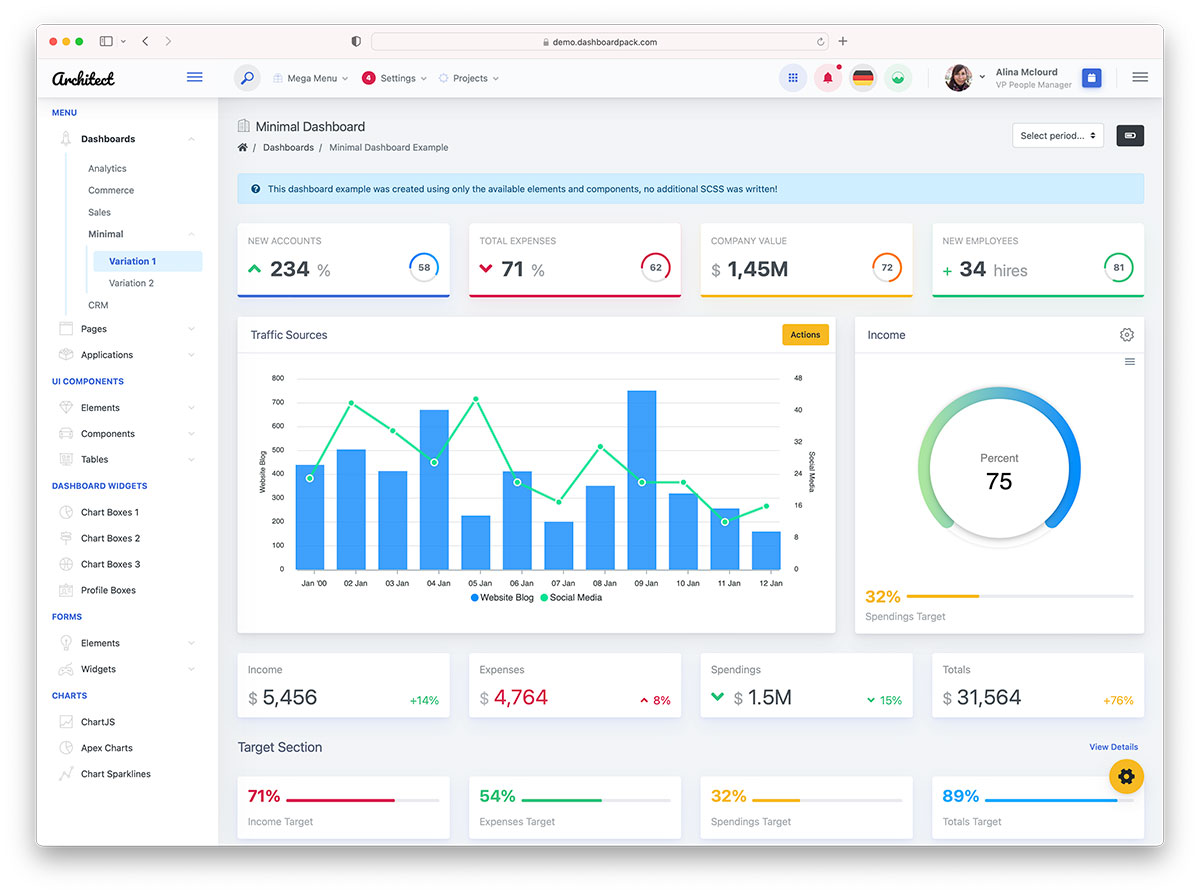
What cannot be measured cannot be managed. Dashboards are a great way to measure, learn, visualize and improve performance of anything that matters to you. Through statistics, charts, graphs, or maps we can stay on top of Product Metrics, Employee Productivity and Happiness and sometimes even our our sleep patterns. So who doesn't need a dashboard.
No Code Dashboard Builders
A dashboard builder is a tool that helps you build these graph and statistics widgest and arrange them so that you can analyze complicated statistical sets and assists in revealing patterns. With the help of dashboard builders, customers can effortlessly build dashboards over a data source; be it for marketing, human resources, income, and production. Mainly, it enables users to understand the performance of something at a glance.
Types of Dashboard
Dashboards could be of several varieties like:
- Tactical Dashboards: Managers needing deeper know-how of an organization’s moves employ them.
- Operational Dashboards: They are carried out in income, budget, offerings, production, and human sources.
- Strategic Dashboards: Senior executives use this to display the organisation's development as it strives to attain strategic dreams.
Open Source Dashboard Builders
Often you need to host the dashboard within your company's premises or within a VPN. This article focuses on dashboard builders which you can easily self host and have all the goodies that you need to stay on top of your metrics without your data ever leaving the building. So here goes.
Appsmith
Appsmith is an open-source framework that allows you to quickly create admin panels, simple CRUD apps, and workflows. The cool thing about Appsmith is that the framework source code is available on GitHub as an open-source project. That also means it’s a free-to-use framework; you can self-host your apps with Docker and use their cloud carrier, which is open to the general public.
Build your UI with their drag-and-drop UI builder. Use 45 pre-built, customizable widgets, which include tables, charts, lists, modals, bureaucracy, and more. Connect to your records with our connectors: databases (PostgreSQL, MongoDB, Amazon S3, and many more), SaaS vendors (like Google Sheets, Airtable, and Twilio), or any GraphQL or REST API.
Connect the statistics to the UI by configuring the components. Where you wish, you could use the Javascript IDE to create extra advanced capabilities and fact differences—the sky is the limit! Deploy your app on their free, cloud-hosted version or on any platform of your preference: Docker, Kubernetes, AWS, DigitalOcean, Heroku, and more.
Features
- Easily connect to famous databases and APIs
- Quickly construct UI with prepared React-powered widgets
- Build internal equipment 10X faster and deliver in clicks
- Customize and expand functionality with code
- Deploy reliably and share with customers securely
- Use 45 equipped widgets to manufacture your apps’ UI in drag-and-drops and clicks
PRICING
- Community: free
- Business: $0.40 per hour, per user
- capped at $20 per user, per month
- Enterprise: custom pricing
Metabase
Metabase is the perfect way to permit anybody in your enterprise to get access to business facts and analytics, examine them, and ask questions. Even if you or your colleagues have no experience in SQL, you could easily summarize and visualize your facts, proportion them, and let your crew ask questions about them.
Metabase creates stunning graphs and charts with an easy-to-use dashboard where people can create, arrange, and share fantastically visualized information. It supports various databases, including Postgres, MySQL, Druid, MongoDB, SQLite, and more. The setup takes five minutes.
Features
- Speedy and simple setup
- Let everybody ask questions, even without understanding SQL.
- Rich dashboards with car refresh and fullscreen alternatives
- SQL Mode for analysts and statistics executives
- Create canonical segments and metrics
- Schedule and send charts or effects via email or Slack
- Metabot lets you view records each time on Slack
- Option to humanize records
- Alerts help you see changes in your records
PRICING
- Starter: $85/month (consists of 5 clients, then $5/person/month)
- Pro: $500/month (consists of 10 clients, then $10/person/month).
- Custom: varies consistent with clients, beginning at $15k (yearly).
Budibase
Budibase is an open-source, open-source, low-cost platform for constructing commercial enterprise packages and dashboards. With over 35,000 downloads in 6 months and over 3,000 stars on Github, it's miles away from turning into the main open-source low-code platform—and for a very good reason.
With Budibase, users can layout, construct, automate, and deploy net apps and user interfaces on their infrastructure in minutes. Users can gain from Budibase’s internal database or hook up with their own. Budibase supports multiple external information assets, including MongoDB, PostgreSQL, MySQL, Elasticsearch, Airtable, and more.
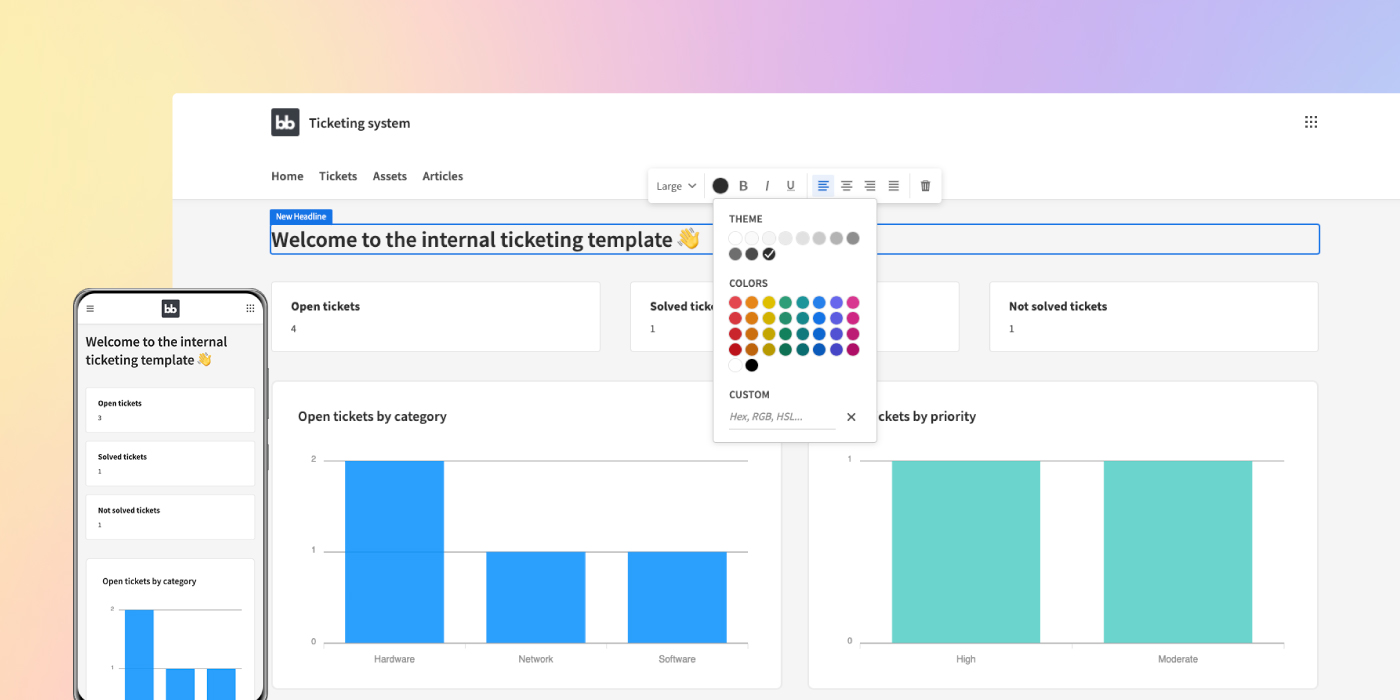
In the layout phase of Budibase, customers can benefit from a catalog of prebuilt, effective additives that they could quickly hook as much as their records. Budibase comes out of the field with prebuilt layouts, consumer authentication, and an information issuer factor that allows users to clear out, type, and paginate information with only a few clicks!
Users can also access numerous prebuilt automation tools, such as Sendgrid, Zapier, Integromat, or a webhook. Automations are easy to create and integrate perfectly with record resources. It is likewise feasible to add Javascript to integrations, increasing extensibility. Budibase is broadly speaking for commercial enterprise apps, and use cases vary from admin panels and dashboards to approval apps and stock lists.
Features
- Clients can self-host their apps on their infrastructure
- Clients can create internal and external equipment
- Budibase has an automation layer, allowing customers to automate obligations including electronic mail notifications, triggering webhooks, and sending a file
- Budibase exports actual single-page applications, presenting customers with a better, more performant experience.
- Budibase offers aid for various famous open-source integrations, databases, and their COTS equivalents.
PRICING
- Free
- Premium: $8 per person/month billed annually or $10 billed monthly
- Business: $16 consistent with consumer/month billed annually or $20 billed monthly
- Enterprise: $15,000 in step with annum
ToolJet
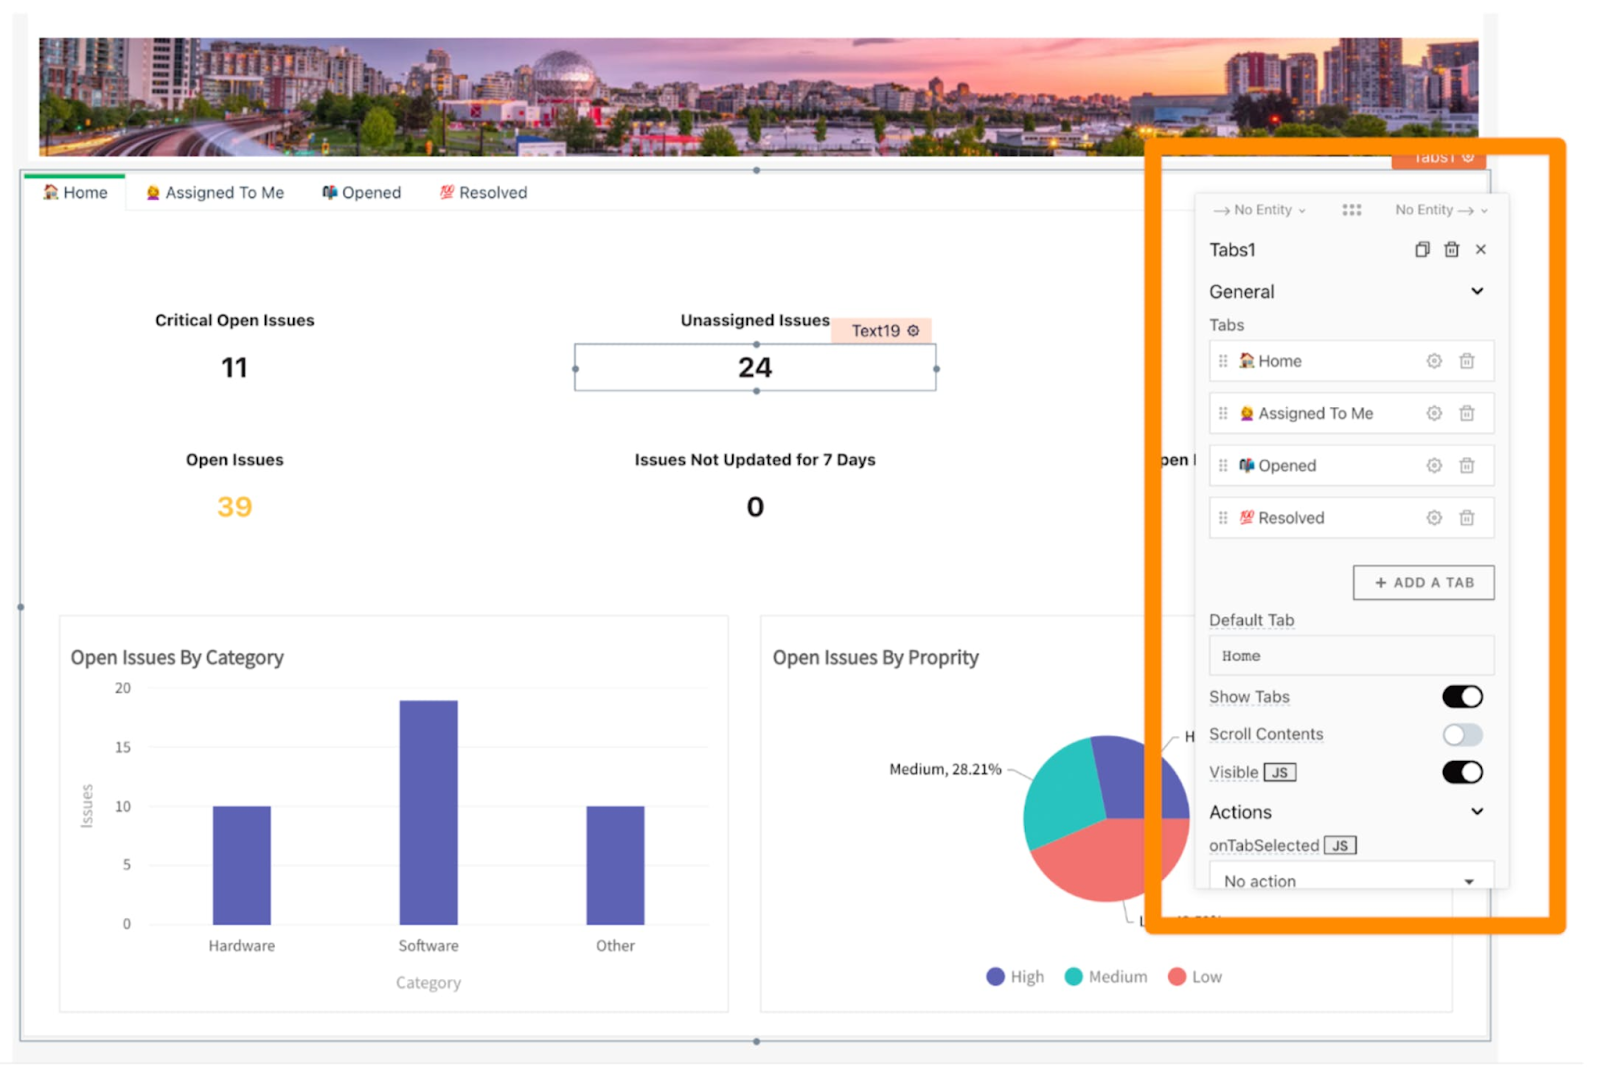
ToolJet is an open-source and occasional-code framework that lets you build dashboards without technical expertise. This framework gives you a UI builder incorporating drag-and-drop tools, default widgets, and cell layouts.
ToolJet can connect with multiple information resources, like Google Sheets, PostgreSQL, Redis, Elastic Search, or even outside apps like Stripe. Also, it comes with a built-in query editor supported by most databases.
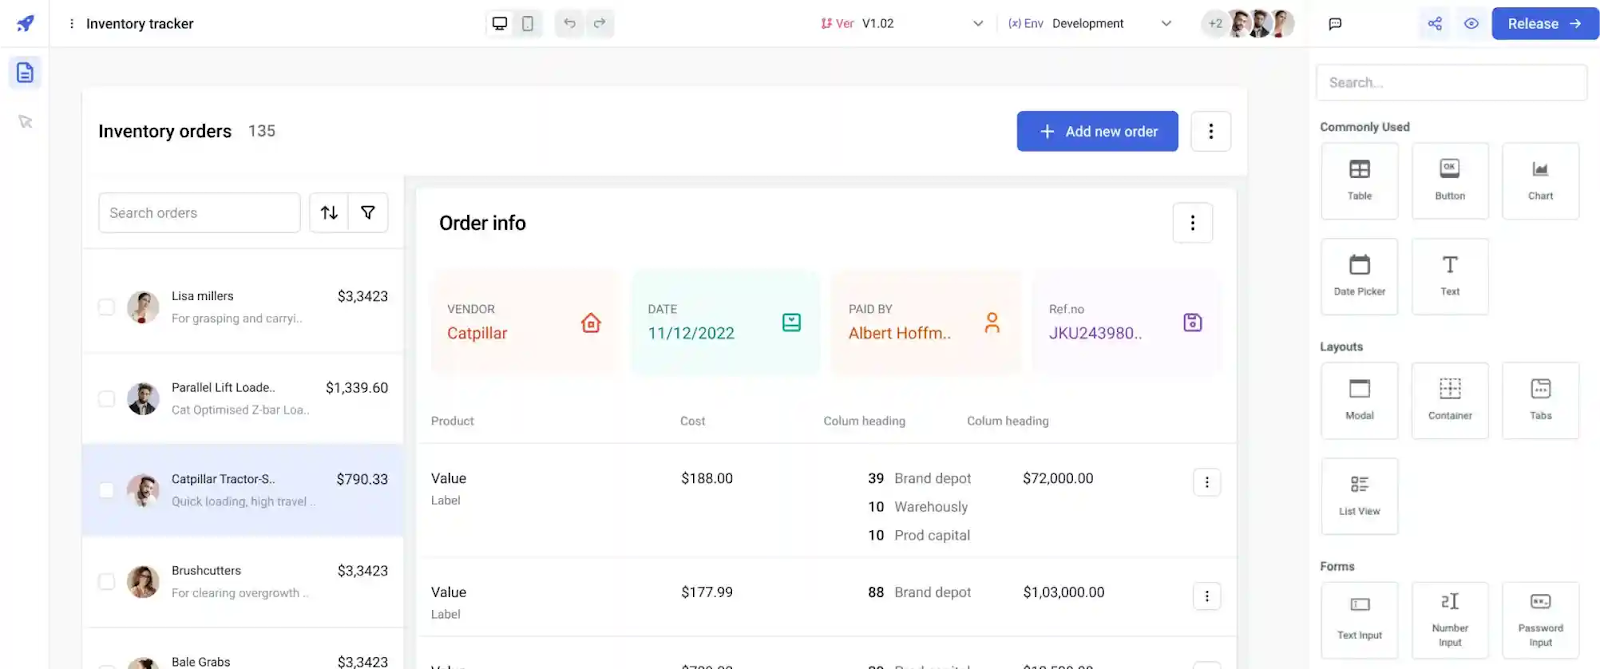
Although it’s a low-code tool, you may write custom JS code inside of the editor in case you need to enforce a custom feature yourself. As it’s an open-source mission, you could contribute to ToolJet’s source code without delay on GitHub.
Features
- Multiple information source options
- Built-in models manipulate
- Easy installation of roles and permissions
- You can host it on any VPC (digital non-public cloud)
- Free ToolJet cloud for up to two apps
PRICING
Basic Plan: $0/month per user
Business Plan:
- $24/month per builder (with an annual 20% discount)
- $8/month per user
Enterprise Plan: Custom pricing
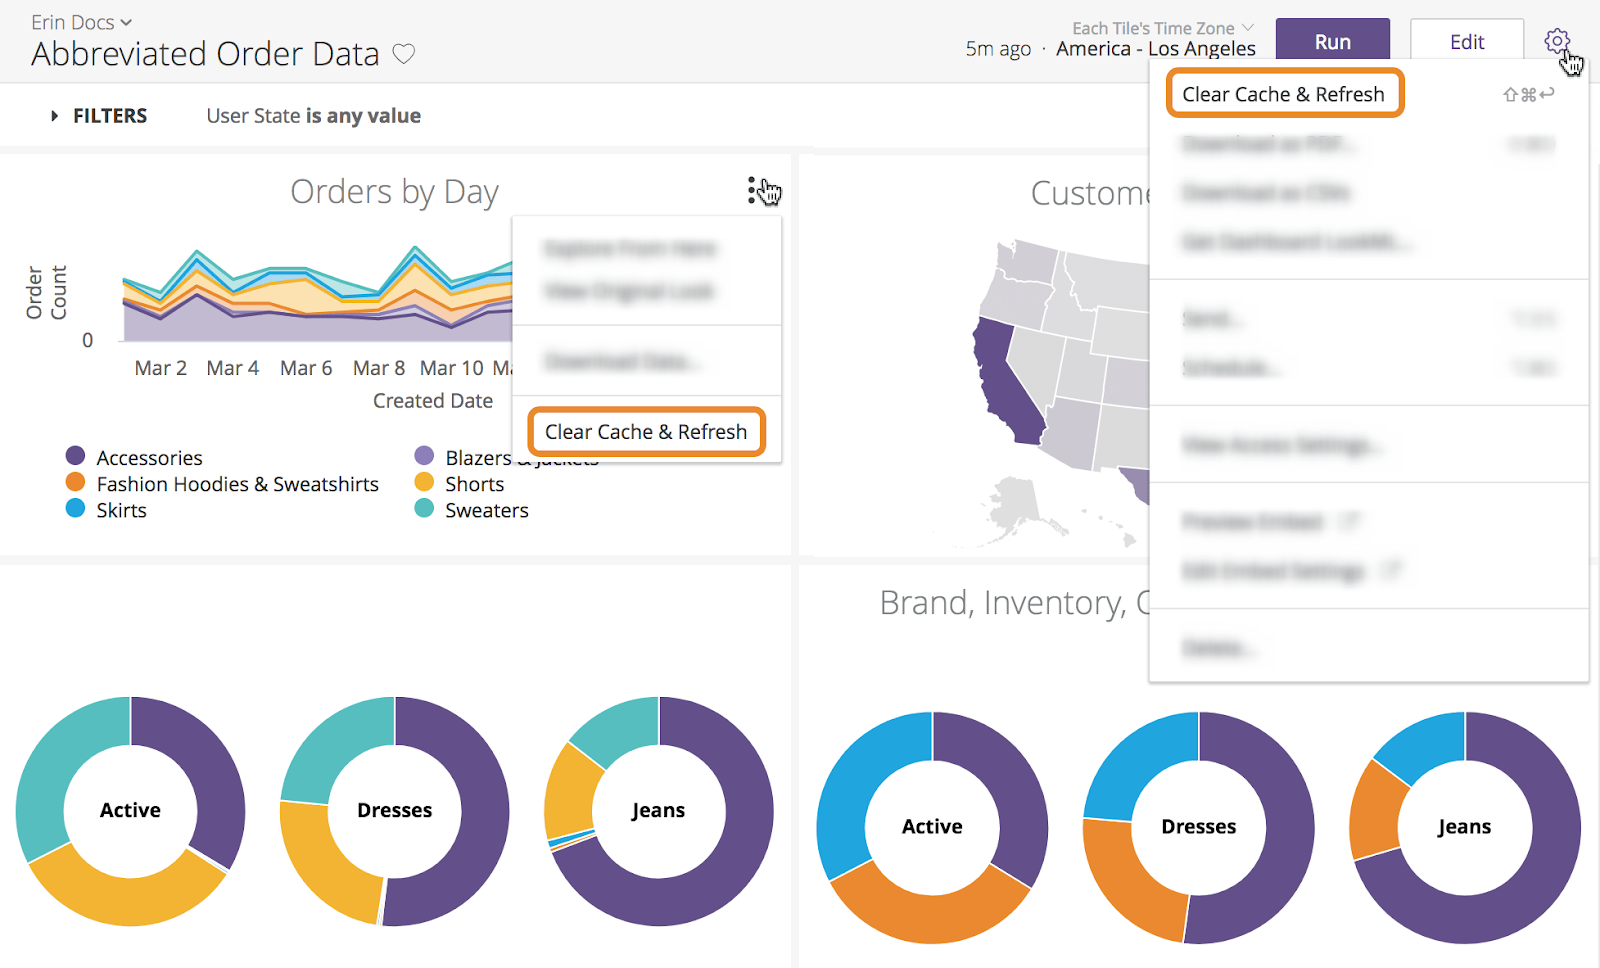
DataStudio (Looker)
Looker is a cloud-primarily based BI platform built on top of an effective statistics modeling layer. Focusing on the “single source of facts” model, Looker’s dashboard brings together information from multiple assets to give organizations an accurate study of numerous metrics.
Looker stands proud for its particular technique for information modeling, which allows customers to define complicated records and create reusable fact models that can be leveraged on the platform. This approach streamlines data exploration and evaluation, so users can be assured about the records displayed on the dashboard.
Numerous highlights and enhancements are associated with the platform’s current 23.4 release. Looker Studio Connector and Connected Sheets are now to be had for all Looker-hosted times, which means customers can get the right of entry to and analyze Looker modeled facts in Connected Sheets and Looker Studio through the connectors, starting up new organization use cases.
The Performant Field Picker Labs function also gives greater delicate seek options, which permit customers to look for fields more quickly and successfully in big Explore field pickers. As the BI arm of Google’s suite of products, Looker has an excessive generality to live up to—and it largely achieves its aim of being a worthy addition to the tech megalith’s software alternatives.
Features
- LookML: Google’s proprietary AI modeling language permits complex queries and fact modeling
- Data governance: Looker affords equipment for handling statistics governance, permitting administrators to set permissions and controls around records get entry to and usage
- Data modeling: Users can create custom-designed record models that can manage large volumes of information from a couple of sources
PRICING
- Free version with limited features and a free 14-day trial for the paid plans
- Viewer User: $30 per user per month
- Standard User: $60 per user per month
- Developer User: $125 per person per month
Conclusion
With interactive visualization gear, you can give meaning to the information in your organization. You can have the essential data required to control an enterprise in a single place by employing dashboard software.
You can explore the crucial measures and tasks and move items within your agency via dashboard software. The leadership crew of the organization wishes to have precious records stated inside the dashboard.
We hope that this list of free and open-source dashboard software will assist you in handling the complexity of running an enterprise and will permit you to consolidate data throughout your agency.
How much is a great User Experience worth to you?
Browsee helps you understand your user's behaviour on your site. It's the next best thing to talking to them.

