Capturing Network Calls via Chrome APIs
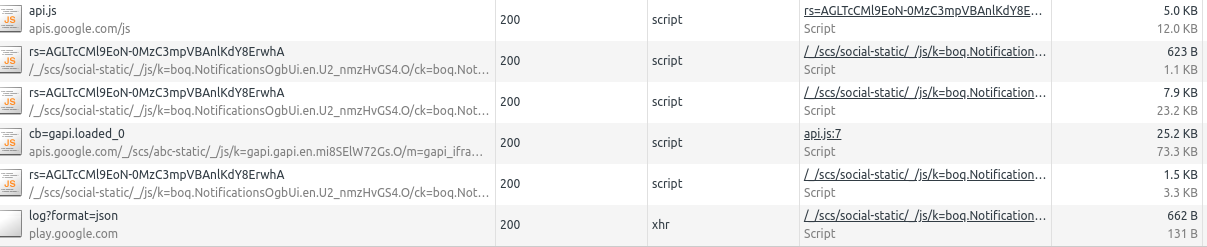
In Browsee, we are always looking to improve the capabilities of our chrome extension to observe user behavior and automating it. This led us to deep into Chrome APIs which we can leverage in our extension. In this post we cover how chrome APIs make it possible to read Network calls, their headers, POST data as well as response.
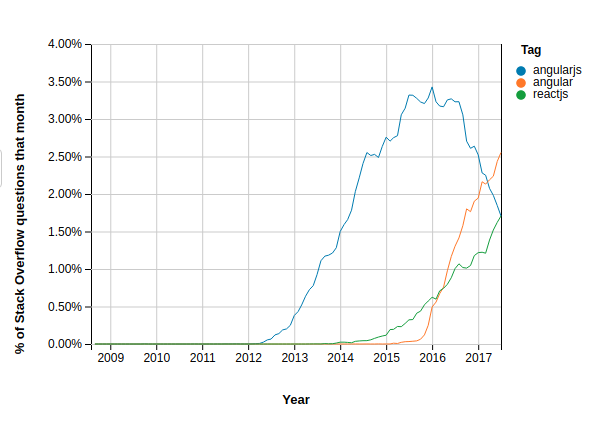
The last few years has seen tremendous growth in Frontend frameworks which help in creating single page apps (SPA's). This is clearly reflected in StackOverflow Trends.
In case you have spent hours debugging SPA's (like I have), you have no doubt spent many of those hours staring at the network logs in the developer tools. In which case, you have wished (like I have) if only I could setup automated tests to observe and test network calls going to various servers from your app. Thanks to Chrome APIs it is now possible to do so via a Chrome extension (or you could simply use Browsee) to setup such a test.
WebRequest API
Lets see how we can do this. The first step is to include webRequests in your extension's manifest file.
"permissions": [
      "webRequest",
      "<all_urls>"
    ],
In case you also want to intercept these requests you will also need webRequestBlocking permission.
background.js
Network call listeners are only available in the background process. If you have specified a background script in your manifest. Add the following listeners to it.
function requestHandler(req){
  console.log(req);
}
function setListeners() {
  chrome.webRequest.onBeforeSendHeaders.addListener(requestHandler,
                                                    {urls: ["<all_urls>"]},
                                                    ["requestHeaders"]);
  chrome.webRequest.onBeforeRequest.addListener(requestHandler,
                                                {urls: ["<all_urls>"]},
                                                ['requestBody']);
  chrome.webRequest.onCompleted.addListener(requestHandler,
                                           {urls: ["<all_urls>"]});
}
function removeListeners() {
  chrome.webRequest.onBeforeSendHeaders.removeListener(requestHandler);
  chrome.webRequest.onBeforeRequest.removeListener(requestHandler);
  chrome.webRequest.onCompleted.removeListener(requestHandler);
}
Okay, great. Time to go into some details. While there are several events in the web requests API that you can listen to, these seem to be the most important.
- onBeforeSendHeaders is needed to know the request beginning. The request headers are provided to you only if you ask for them (notice
requestHeadersin the listener). - beforeRequest is needed to know the POST data, which is only provided if you ask for it (notice
requestBodyin the listener). - onCompleted is needed for response status.
In case you don't want to perenially observer all network calls you can invokeremoveListeners to delete the listeners we have set.
To undestand the events and the listeners in greater depth do go over the API doc.
Reading POST data
Unfortunately, the simple listener we used for onBeforeRequest is not able to parse requestBody when its sent as raw bytes. The solution as per this stackoverflow thread is to parse the raw bytes as follows
function onBeforeRequestHandler(req) {
  if (req.requestBody && req.requestBody.raw) {
    var requestBody = req.requestBody.raw.map(function(data) {
      return decodeURIComponent(String.fromCharCode.apply(null, new Uint8Array(data.bytes)));
    }).join('')
  }
}
Visualizing Requests
In case you want to visualize these requests, you will have to create a runtime connection and send these requests as a message to the scripts handling your visible layers. You can store a runtime communication port in your background listener as follows
browser.runtime.onConnect.addListener(function(m) {
  port = m;
}
and then use this port to send the requests you have logged by adding the following in your listener functions.
port.postMessage({'type' : type , 'request' : req})
And that's it. This should let you get started with listening and visualizing all the network requests.
How much is a great User Experience worth to you?
Browsee helps you understand your user's behaviour on your site. It's the next best thing to talking to them.

