Analyzing Amplitude vs. Browsee: A Product Manager's Guide to Analytics Tools
Amplitude and Browsee are sophisticated analytics tools that are designed to help product managers like you. In today's market, understanding user behavior and optimizing your user experience is essential for a product manager.
Amplitude specializes in product analytics, providing real time data on user engagement. Browsee, on the other hand, specializes in visual tracking through session replay and heatmaps. In this article will discuss all the analytical tools' features, functions, and usage.
This comparison will help you choose the appropriate tool for empowering product managers to make informed decisions and move their organizations toward excellence.
Amplitude
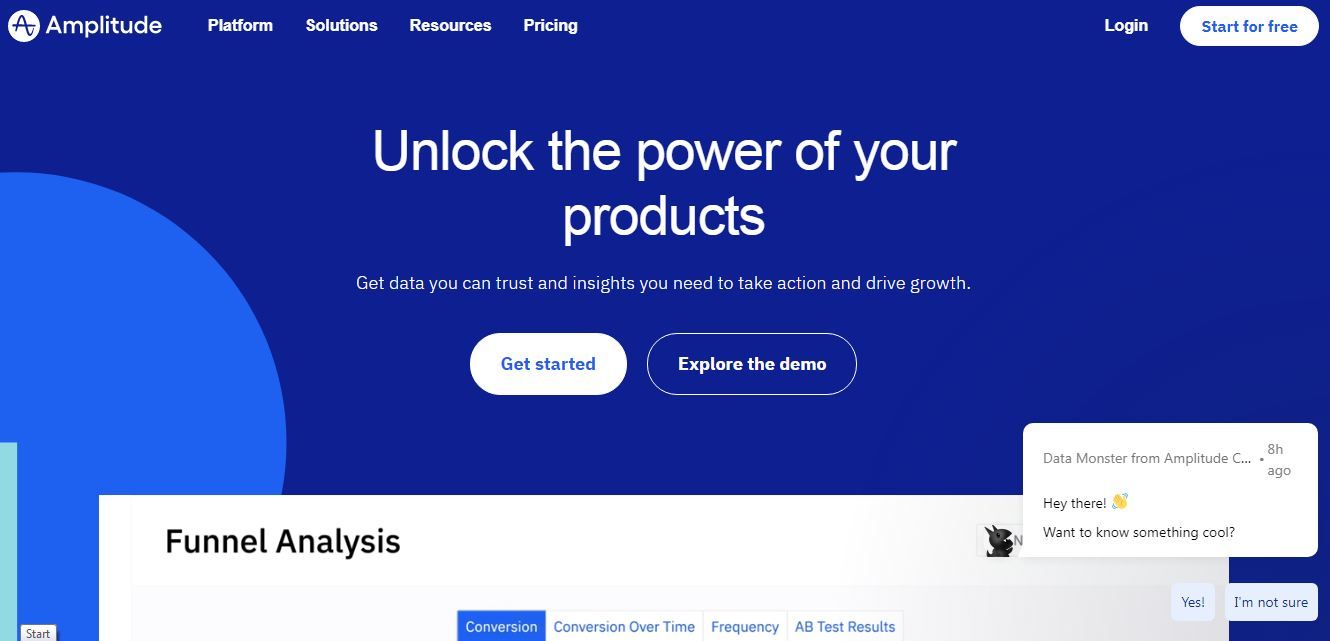
Amplitude is an analytics tool that provides data based insights to organizations. Its user-friendly interface enables you to perform deep tracking and analyze user behaviour, helping businesses better to understand user engagement, and conversion rates. Its robust features cater to product managers and marketers, allowing them to improve user experiences while driving corporate growth.
Browsee
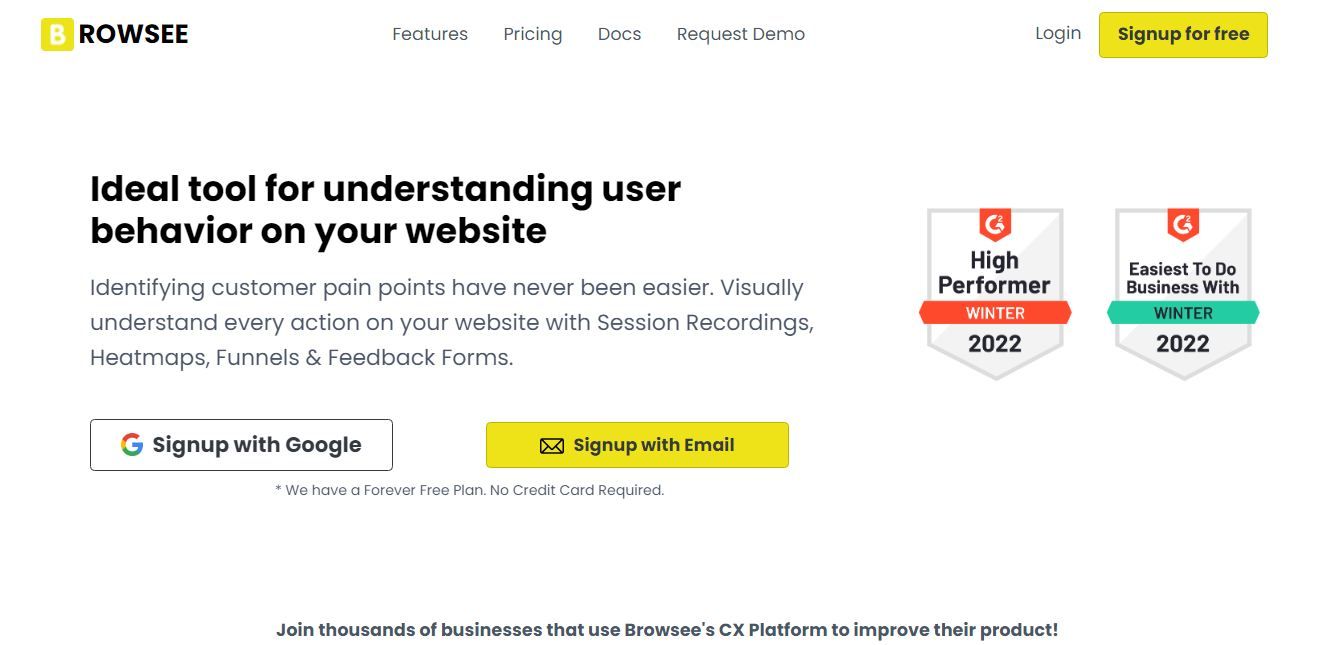
Browsee is a unique analytic software tool that revolutionises how organisations analyse user behaviour on their websites and mobile apps. Browsee's session replay and heatmaps tools provide useful insights into user interactions, allowing businesses to optimise their digital experiences.
Features of Browsee
Below are the detailed features and benefits of the Browsee analytics tool:
Session Replay:
Session recording tools will show how users interact with your website or mobile app. This feature of Browsee understands user behavior, uncovers usability issues, and identifies areas for improvement. You can identify the user’s pain points and friction by replaying the session recording on your website.
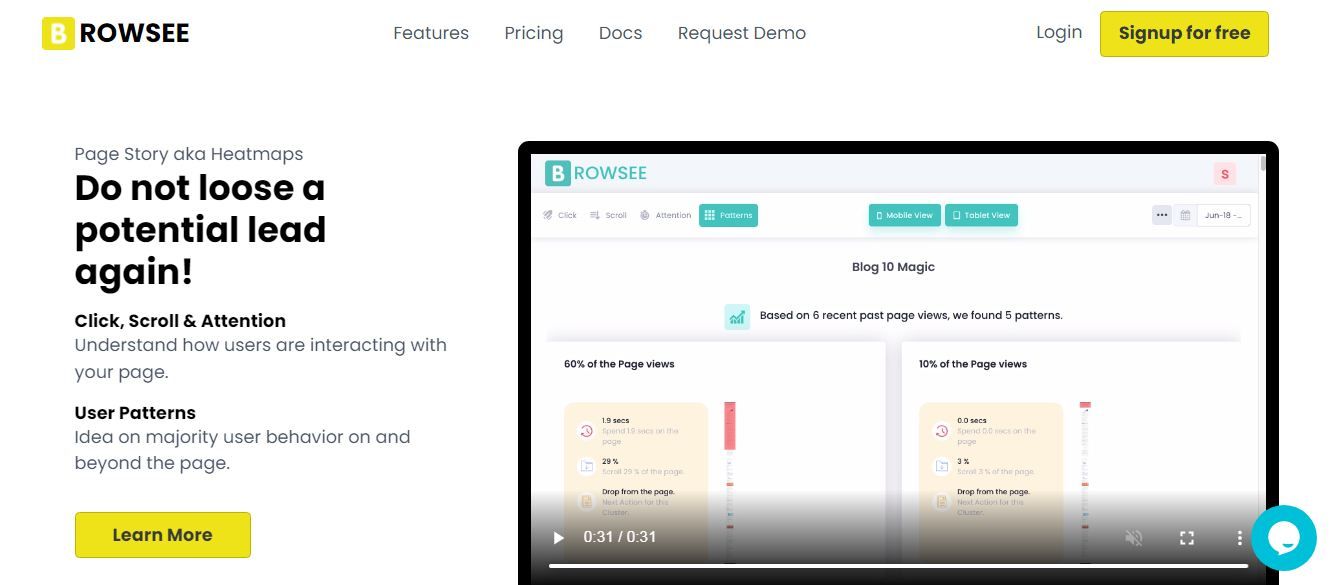
Heatmaps:
With Browsee's heatmaps, you can visualize user engagement and behavior patterns on your web pages. These visualizations indicate where users click, scroll, and spend the most time, providing essential data to optimize your website's layout and design.
Conversion Funnels:
Browsee's conversion funnel analysis helps you track user journeys and identify drop-off points in the conversion process. This feature allows you to pinpoint where users abandon their sessions, enabling you to implement targeted improvements to increase conversion rates.
Segmentation and Filters:
Browsee allows you to segment your data based on various parameters, such as device type, traffic source, or user behavior. This capability enables you to analyze specific user groups separately and make data-driven decisions to optimize their experience.
Custom Events:
Browsee's custom events feature allows you to track specific actions or interactions on your website that are relevant to your business goals. Whether it's form submissions, button clicks, or downloads, this functionality helps you understand user engagement with your key elements.
Real-Time Data:
Browsee provides real-time analytics, ensuring you can monitor user activity as it happens. This immediate feedback enables you to respond quickly to any issues or opportunities that arise, ultimately enhancing your website's performance.
User Flow Analysis:
The user flow analysis feature in Browsee enables you to visualize the paths users take on your website. This insight helps you optimize the user journey, reduce drop-offs, and improve overall user satisfaction.
Features of Amplitude
Below are the detailed features and benefits of the Amplitude analytics tool:
Event Tracking:
Amplitude allows businesses to track and analyze user interactions as events. Whether it's clicks, sign-ups, or purchases, event tracking provides valuable insights into how users engage with the product.
Funnel Analysis:
With funnel analysis, Amplitude enables businesses to visualize the user journey from one event to another, identifying drop-off points and potential bottlenecks in the conversion process. This feature helps optimize the user experience and increase conversion rates.
Cohort Analysis:
Amplitude's cohort analysis lets businesses group users based on common characteristics or behaviors. This functionality enables in-depth examination of user retention and engagement trends over time, helping to tailor strategies for specific user segments.
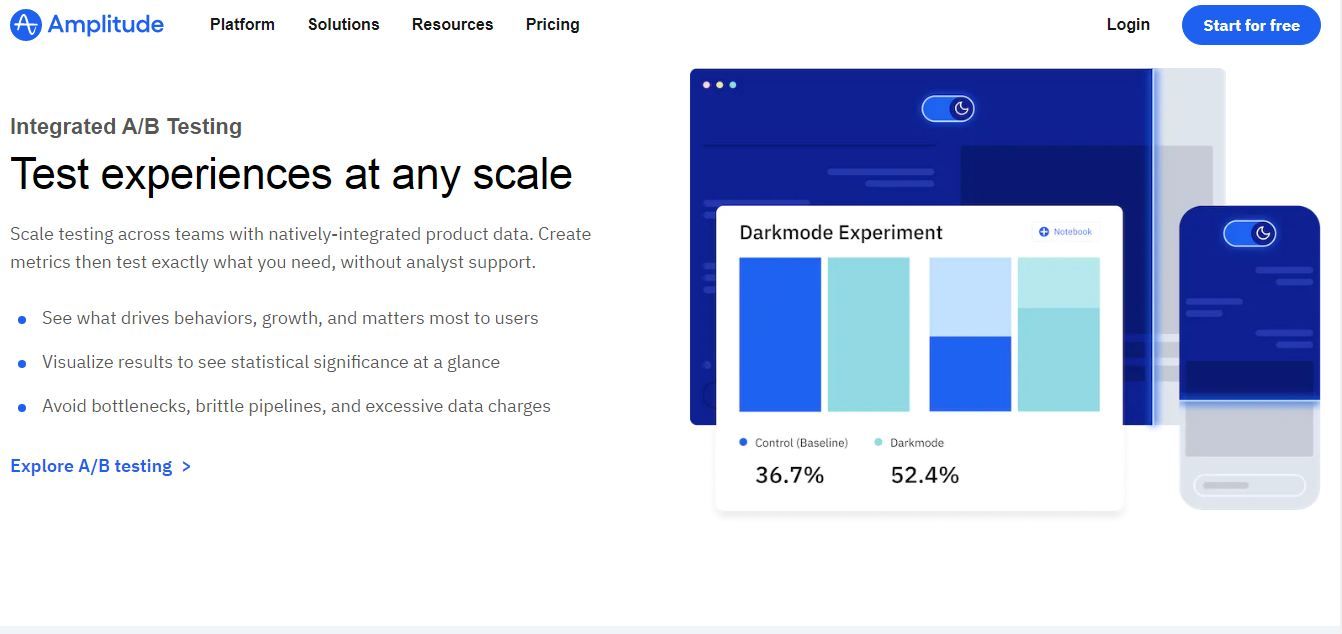
A/B Testing:
Amplitude offers robust A/B testing capabilities, allowing businesses to experiment with different variations of their product and measure the impact on user behavior and key metrics. This feature aids data-driven decision-making to improve product performance.
Behavioral Segmentation:
Amplitude enables businesses to segment users based on their behavior, such as power users, inactive users, or frequent purchasers. This segmentation helps target personalized marketing efforts and tailor product features to specific user groups.
Real-time Data:
Amplitude provides real-time analytics, allowing businesses to monitor user activity as it happens. This feature enables timely responses to emerging trends, issues, or opportunities.
User Profiles:
Amplitude allows creating user profiles, consolidating user data into a single view. This feature aids in building a holistic understanding of user behavior and preferences.
Data Governance and Security:
Amplitude prioritizes data governance and security, ensuring compliance with privacy regulations and safeguarding user data.
Mobile App Analytics:
Amplitude offers specialized analytics for mobile apps, providing valuable insights into user behavior and engagement on mobile devices.
How will Browsee add value to you as a Product Manager?
As a Product Manager, you can leverage Browsee to add value in several ways:
User Behavior Insights:
Browsee provides in-depth insights into user behavior on your website or application. You can analyze user interactions, such as clicks, scrolls, form submissions, and more.
This data can be invaluable for product managers in understanding how users engage with the product, identifying pain points, and making data-driven decisions for improvements.
User Experience Optimization:
By understanding user behavior through Browsee, product managers can identify usability issues, roadblocks, and bottlenecks in the user journey. This data can help prioritize improvements in the user experience, resulting in higher user satisfaction and retention.
Conversion Rate Optimization (CRO):
Browsee can assist product managers in optimizing the conversion funnel by tracking user behavior during the conversion process. Product managers can make targeted changes to increase conversion rates and drive business growth by identifying drop-off points or areas where users struggle.
Bug Detection and Issue Resolution:
Product managers can use Browsee to spot and troubleshoot technical issues experienced by users. By analyzing user sessions, you can pinpoint where errors or bugs occur, allowing the development team to address issues promptly.

Competitor Analysis:
By using Browsee to analyze user behavior on competitors' websites, product managers can gain insights into their strengths and weaknesses. This information can be used to identify potential areas of differentiation and opportunities for improvement in your own product.
Data-Driven Decision Making:
Overall, Browsee enables product managers to base their decisions on real user data rather than assumptions or guesswork. This data-driven approach can lead to more effective product strategies and better outcomes.
How will Amplitude add value to you as a Product Manager?
Here are some key ways Amplitude can add value to your role as a Product
Manager:
Data-driven decision-making: Amplitude provides you with comprehensive data about how users interact with your product. You can track user behavior, identify patterns, and understand user journeys. With this data at hand, you can make informed decisions about product improvements, feature prioritization, and overall product strategy.
User segmentation and analysis:
Amplitude allows you to segment your user base based on various attributes and behaviors. This segmentation helps you understand different user groups' preferences and needs, enabling you to personalize the product experience and tailor features to specific user segments.
Funnel analysis:
You can use Amplitude to analyze user funnels and identify drop-off points in the user journey. This helps you pinpoint areas where users may be encountering issues or challenges, allowing you to optimize the onboarding process and enhance user retention.
Product performance tracking:
Amplitude helps you track key product metrics and KPIs, such as conversion rates, user engagement, and revenue metrics. This information enables you to monitor product performance and identify areas for improvement.
Real-time monitoring:
Amplitude provides real-time data updates, allowing you to monitor the impact of product changes and marketing campaigns as they happen. This immediacy helps you respond quickly to any issues or opportunities that arise.
Collaboration and reporting:
Amplitude enables you to share data and insights with stakeholders easily. You can create customizable reports and dashboards to communicate product performance and user behavior trends to the broader team, facilitating collaboration and alignment across departments.
Price of the Plans
Browsee
Here are the different price plans that you can opt for your brand:
Free -
Free Plan with all the features and 1,500 Recordings Per Month.
Starter -
For $19 Monthly you can avail all the features and 400,000 Page Views Per Month.
Plus -
For $46 Monthly you can again avail all the features and 800,000 Page Views Per Month.
Pro -
For $103 Monthly you can again avail all the features and 1,000,000 Page Views Per Month.
Executive -
For $239 Monthly you can again avail all the features and 2,000,000 Page Views Per Month.
Amplitude
Amplitude's pricing is based on the number of Monthly Tracked Users (MTUs) and the features you require. The exact pricing details can be obtained from Amplitude's website, as they offer customized plans for businesses of different sizes.
The price that you have to pay for Amplitude Analytics is based on MTUs or Monthly Tracked Users and on the features that you need for your brand. There are three plans of Amplitude analytics that you can obtain.
Starter -
Free Plan with unlimited events with 100,000 Monthly Unique Users (MTUs)
Growth -
You have to contact them through their website for the prices. This plan includes 1 Million Monthly Unique Users and unlimited events
Enterprise -
You have to contact the company’s Sales department to know the custom price.
Conclusion
Both Amplitude and Browsee, when compared as analytics solutions for Product Managers, provide useful capabilities to support data-driven decision-making. The complete user behavior analysis, A/B testing, and real-time monitoring capabilities of Amplitude make it an outstanding choice for optimizing product performance. Browsee, on the other hand, focuses on session replays and visual analytics, which provide unique insights into user interactions. Specific product management requirements and preferences ultimately determine the decision between the two.
How much is a great User Experience worth to you?
Browsee helps you understand your user's behaviour on your site. It's the next best thing to talking to them.

